
Junior RevOps Roles Are in Trouble
100% of some junior roles can be done by AI. It won't stop there.

I recently made the case that AI would massively shrink RevOps teams.
My argument was pretty simple. Most of the jobs done by RevOps have a high AI “automation ceiling”. That, combined with continued improvements in AI capabilities and financial pressure for more efficiencies, means that RevOps teams are destined to shrink. It’s a reasonable take (if I do say so myself), but it lacked data—and I don’t much like to make arguments without data.
So, I decided to bring some data to the table. I analyzed a sample of 237 RevOps job postings from 210 companies to extract the most common jobs-to-be-done (JTBD) and score those based on how likely they are to be impacted by AI.
Key findings:
RevOps is a reporting and analytics function at most organizations. The most common JTBD is “Build dashboards and recurring reports”, found in 68% of all job postings.
Junior roles are the most likely to be disrupted by AI, regardless of company size. For some junior job posts, 100% of the included JTBDs can be fully replaced with AI, implying those roles may not exist in the near future.
RevOps roles in smaller companies are more exposed to AI than those in larger companies. Ironically, the stakeholder and communication overhead found at larger companies may (temporarily) protect some of those roles.
Now, on to the details.
A little background
Some of you may remember seeing this radar chart from Anthropic making the rounds a couple months back:
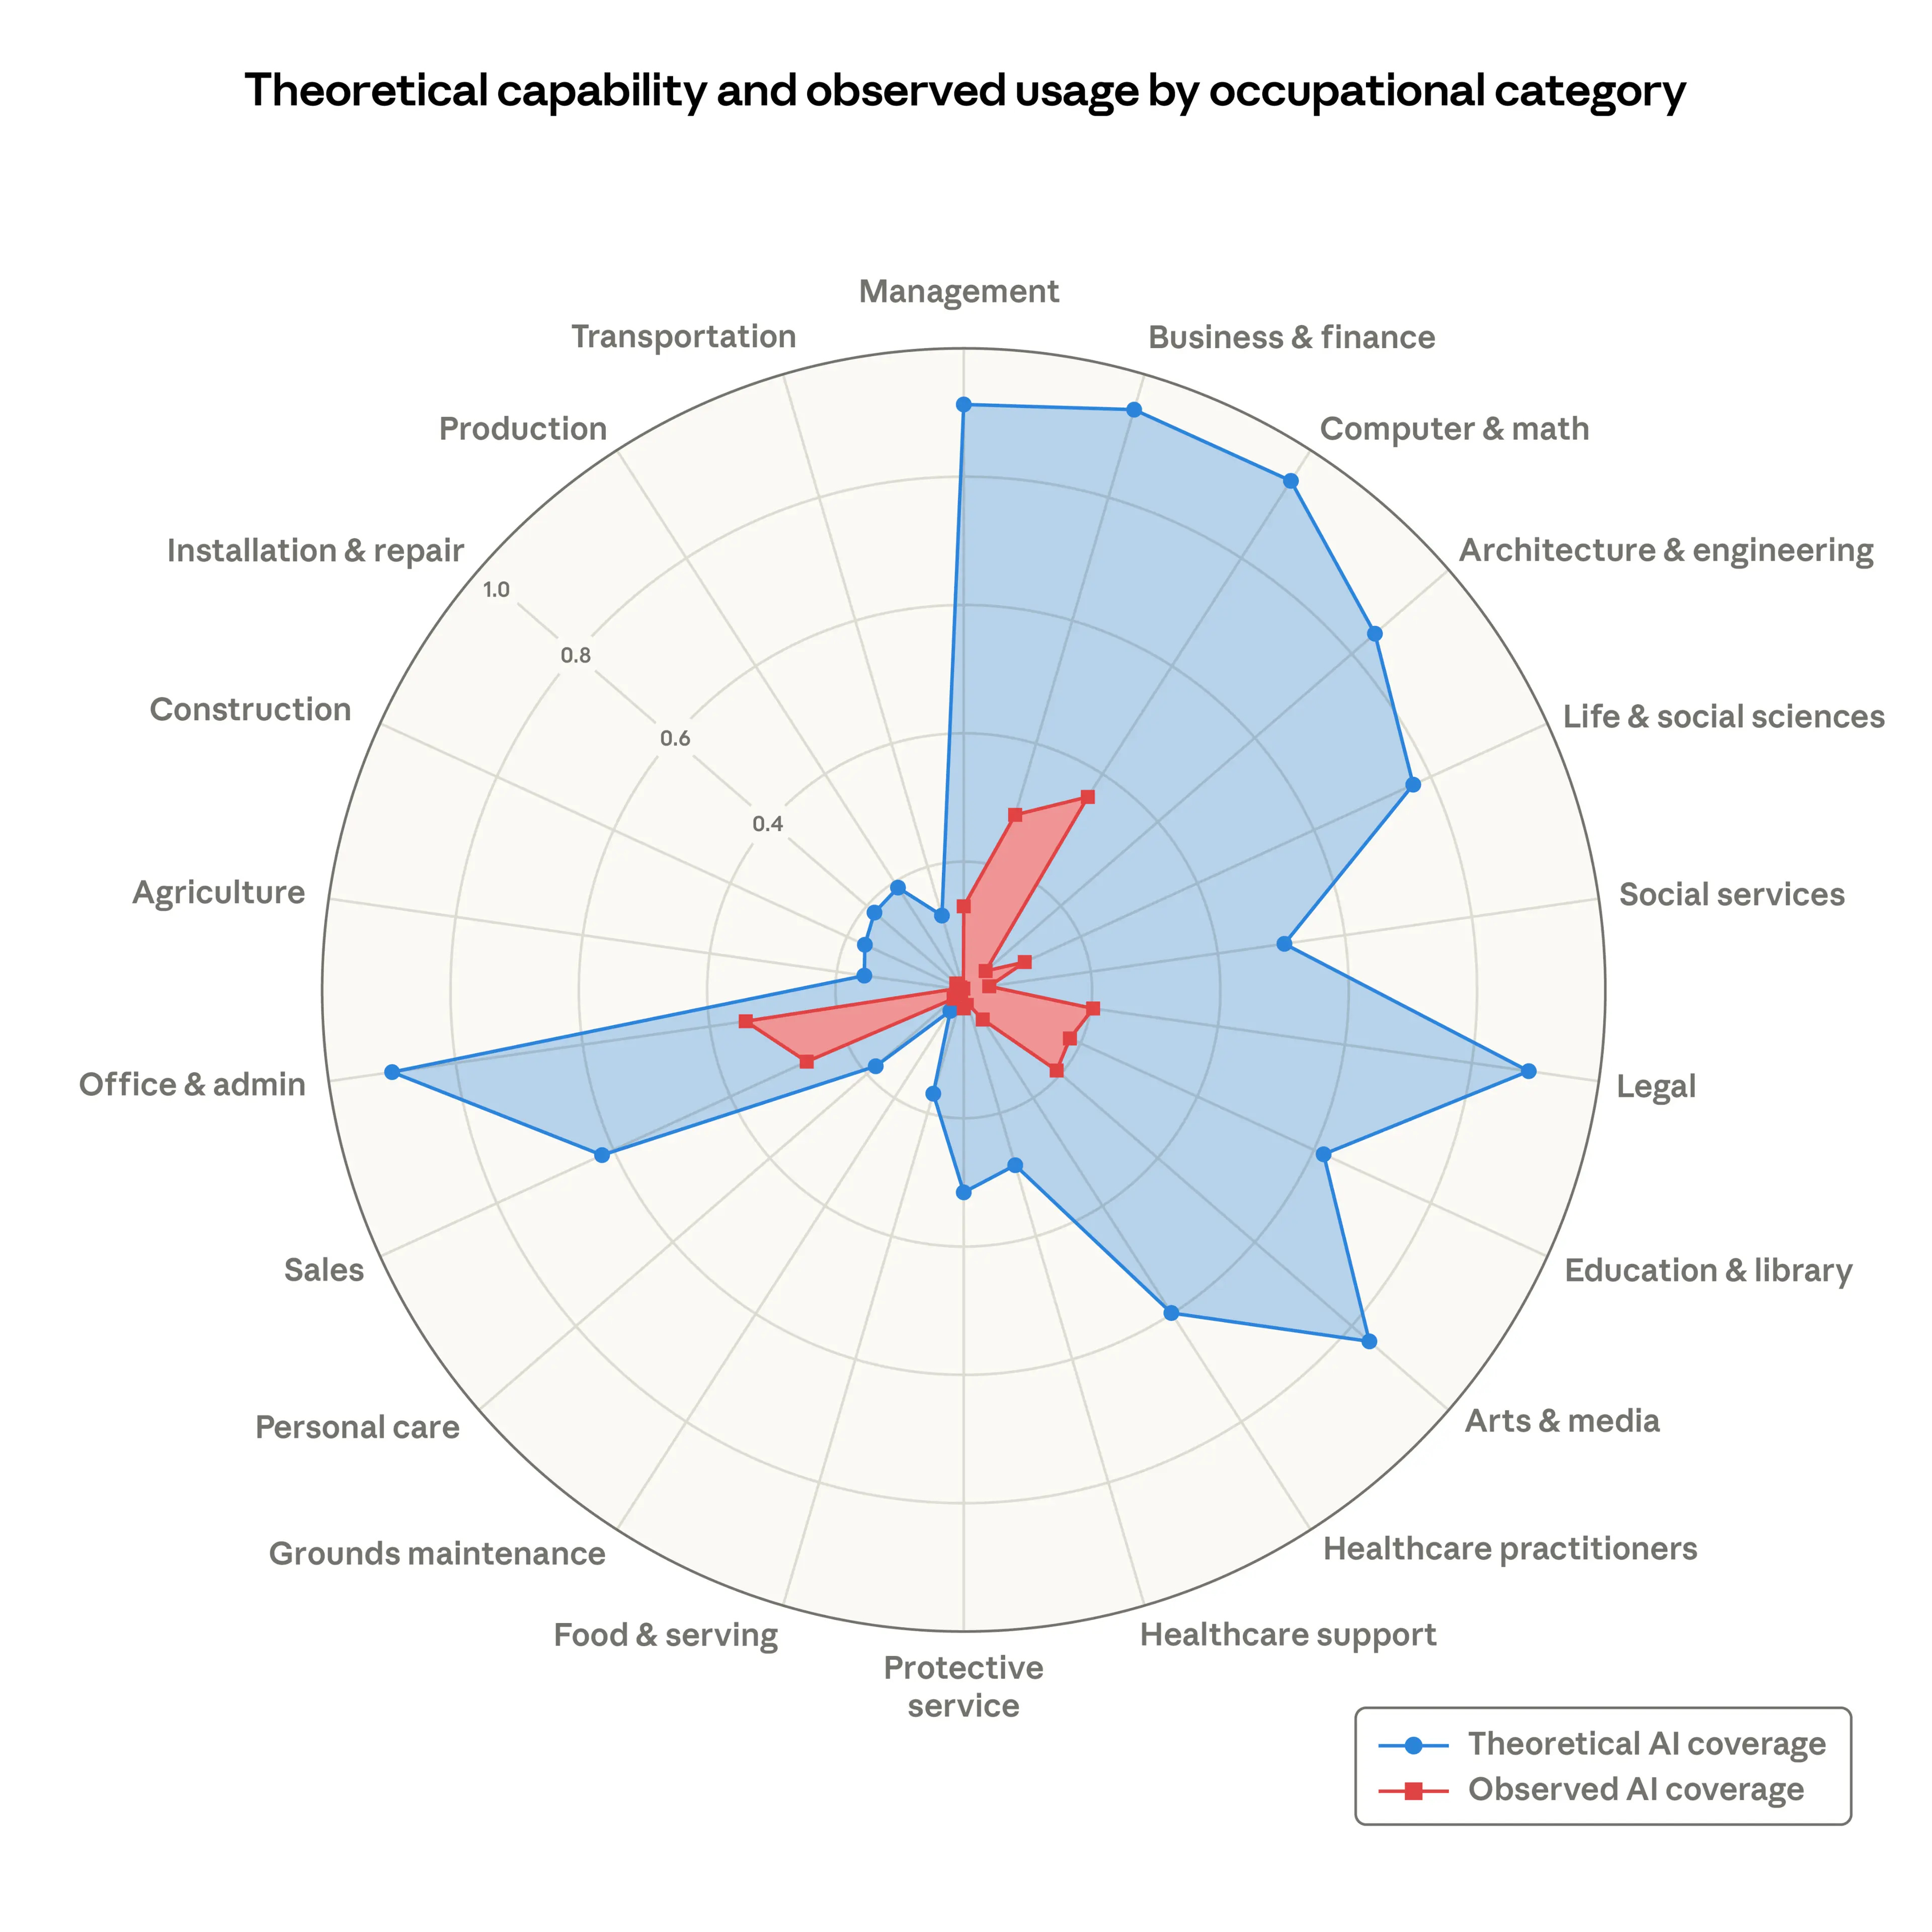
I saw a lot of takes about it. My LinkedIn feed is mostly populated by sales folks so I saw a few posts highlighting that, of “knowledge work”-type jobs, sales was (slightly) safer from AI disruption. I think that was supposed to sound reassuring, but it really wasn’t.
Some people, however, questioned the whole concept:
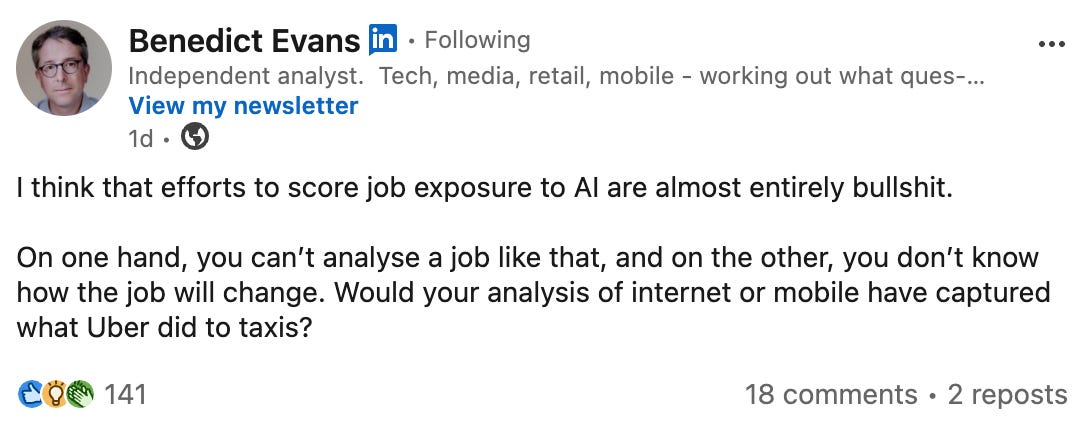
Seeing this take, I said to myself, “Hey, why don’t I make an effort to score RevOps job exposure to AI?”1
A brief note on methodology
My goal was to zero in on “traditional” GTM-focused operations jobs at established companies. Given the industry standard 1:12 (ops:seller) ratio, there are plenty of jobs at stake there.
To do that, I (and my buddy Claude) sampled job posts from the last ~15 days aggregated by TheirStack with “revops”, “revenue operations”, “sales operations” and “marketing operations” in their titles at companies with more than 200 employees.2 This means the analysis does not include very small companies or new titles like “GTM Engineer”.
We assigned each job posting a company size band based on number of employees as well as a seniority level:
Senior - Director-level or above
Mid-level - Managers and senior ICs
Junior - ICs with titles like analyst, specialist, etc.
Then, I worked with Claude to build a taxonomy of “jobs-to-be-done” (JTBD) that were represented across roles and put those into categories. After a few rounds, we ended up with 13 categories and 66 JTBDs. For example, the CRM & Systems Administration category contains 5 jobs to be done:
Administer the core CRM
Own GTM tech-stack integration
Evaluate and onboard new tools
Operate and architect AI-assisted workflows
Administer CPQ and quote-to-cash systems
You can see the whole taxonomy here.
The final data set contains 237 sample job posts from 210 companies, each with a company size band, seniority level and a list of associated jobs-to-be-done from our JTBD taxonomy.
So, what did we learn?
RevOps, reporting for duty
RevOps is, more than anything else, a reporting and analytics function. Take a look:
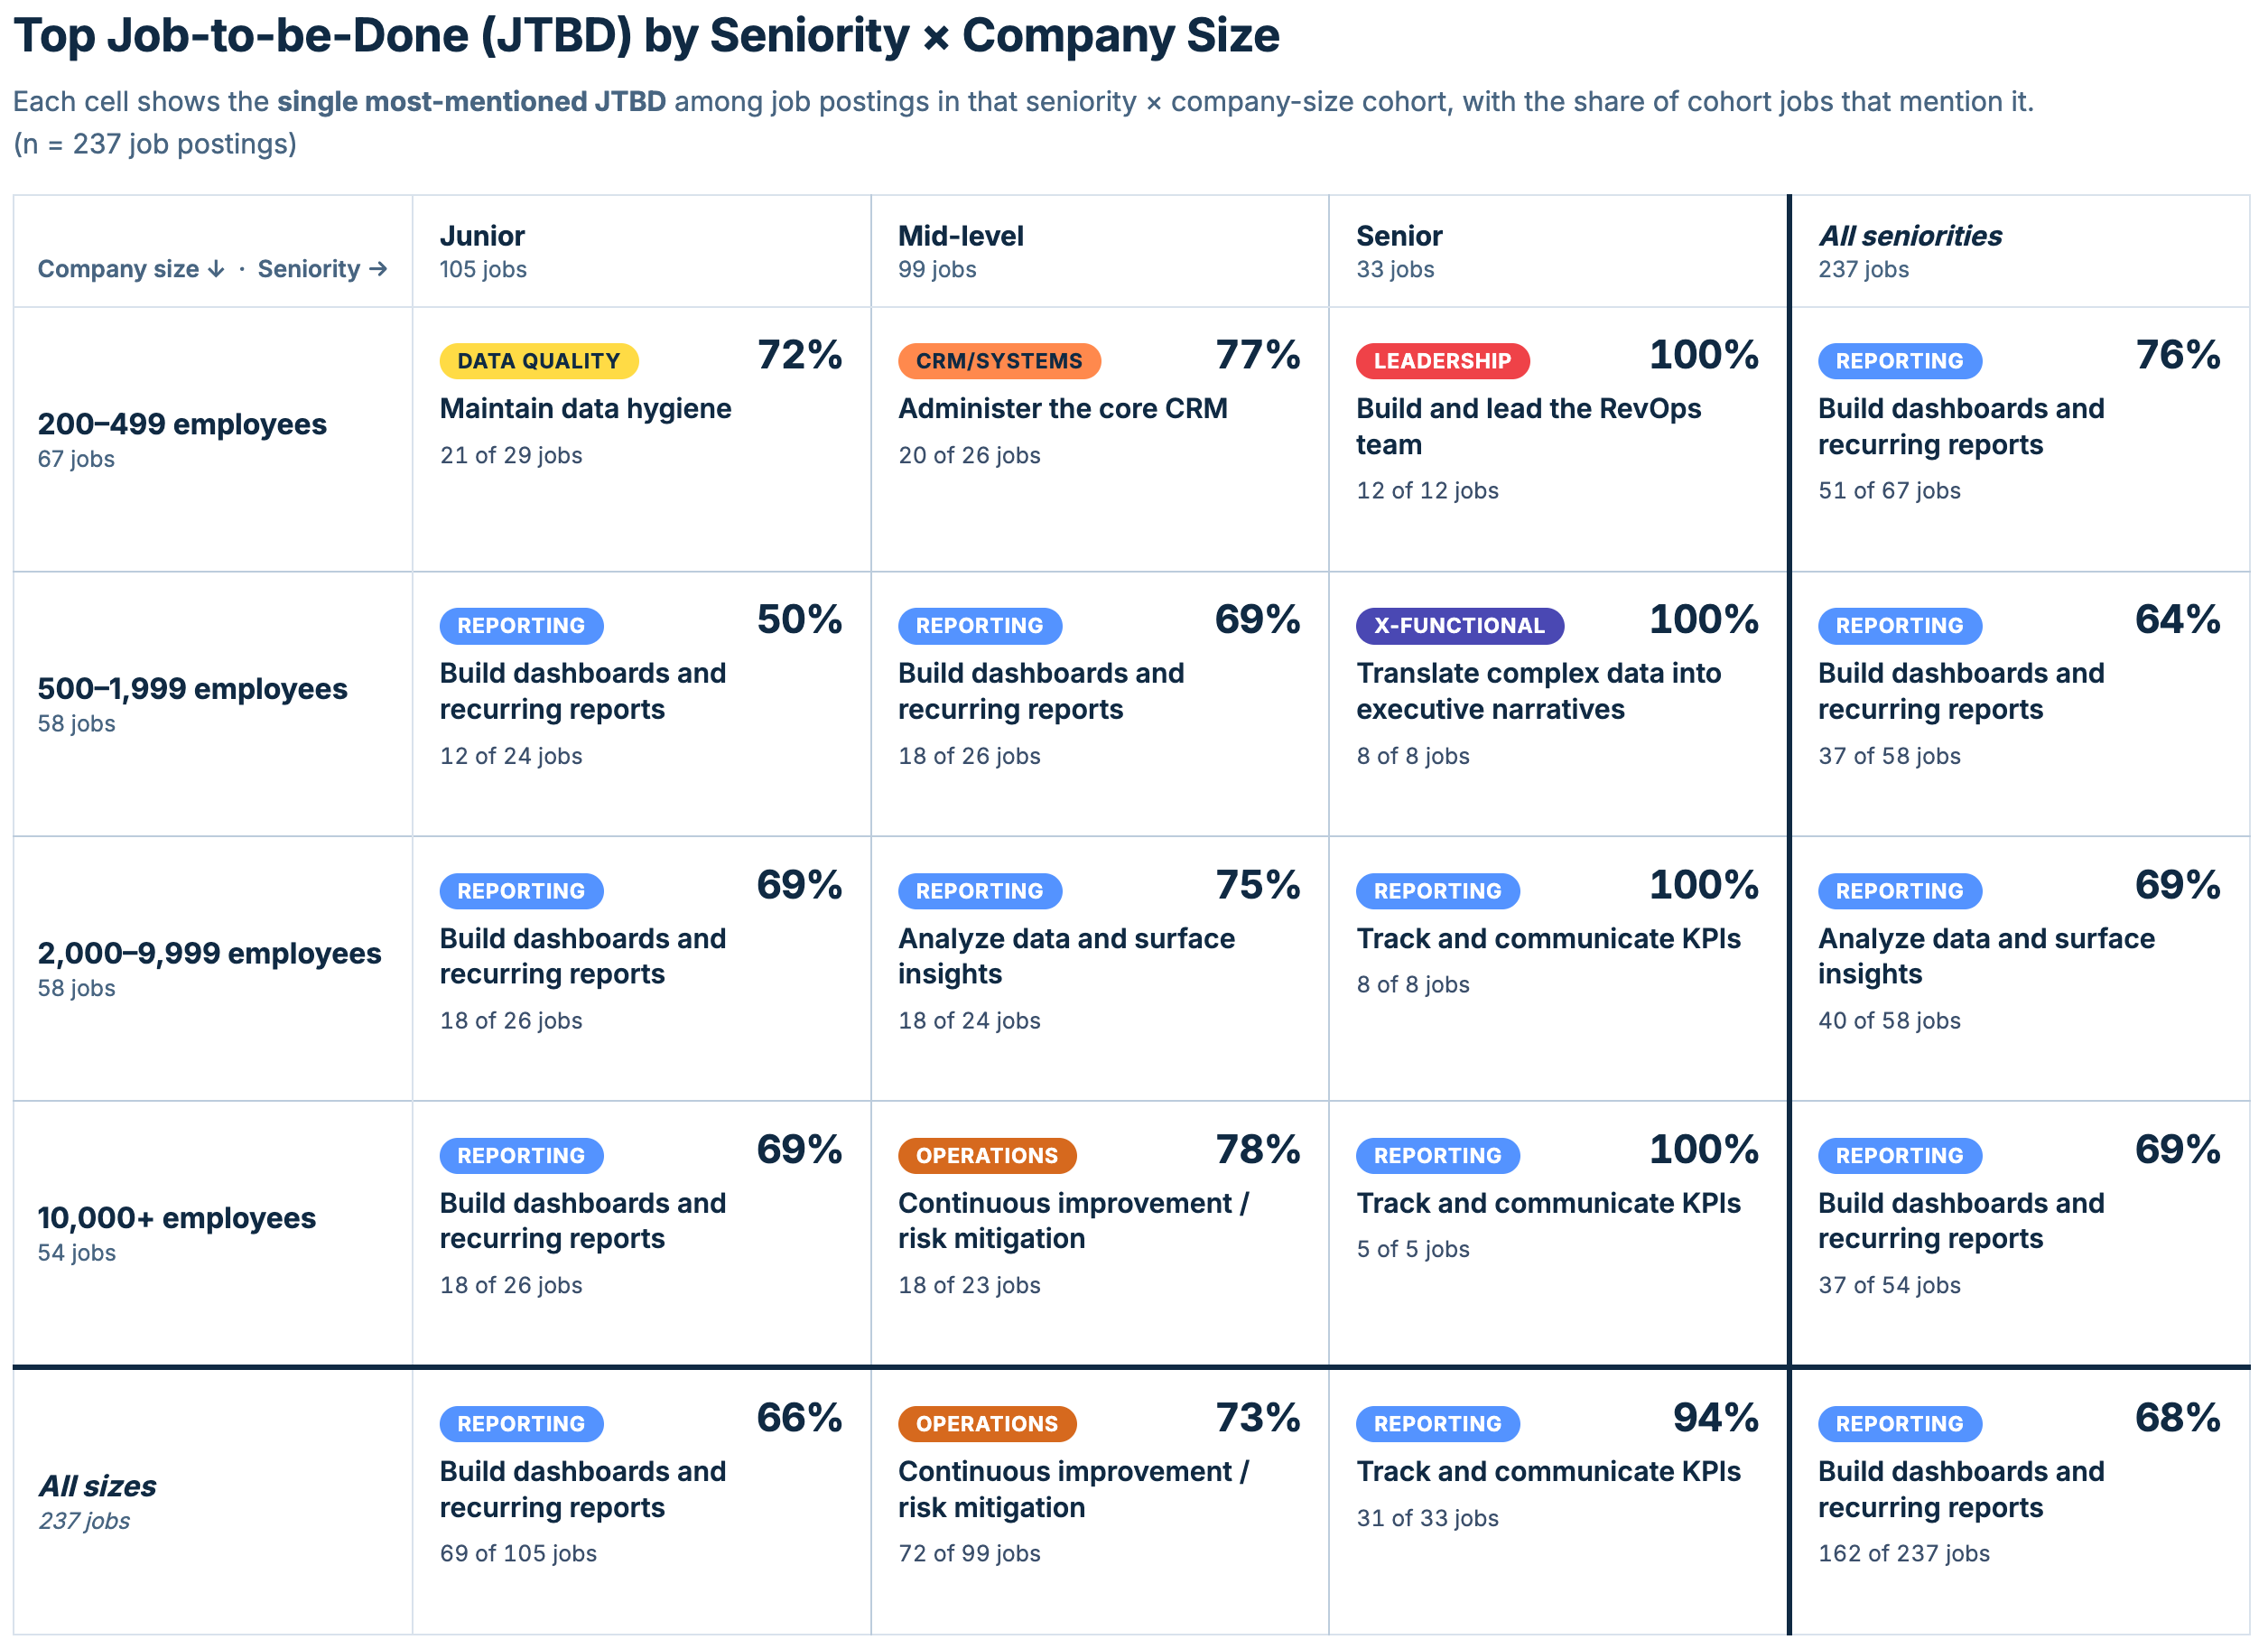
The most common JTBD, found in 68% of all job posts, is building dashboards and reports. This doesn’t vary meaningfully by company size.
Breaking this down further by company size and role seniority, Reporting & Analytics is the top category in 7 of the 12 size x seniority buckets. The kind of reporting does vary by seniority: juniors build dashboards, while seniors are the keepers (and communicators) of the KPIs for the business.
Reporting is the most common JTBD, but how do different JTBDs come together to form a RevOps role? To answer that, I built a table showing how often JTBD categories appear together in a role.
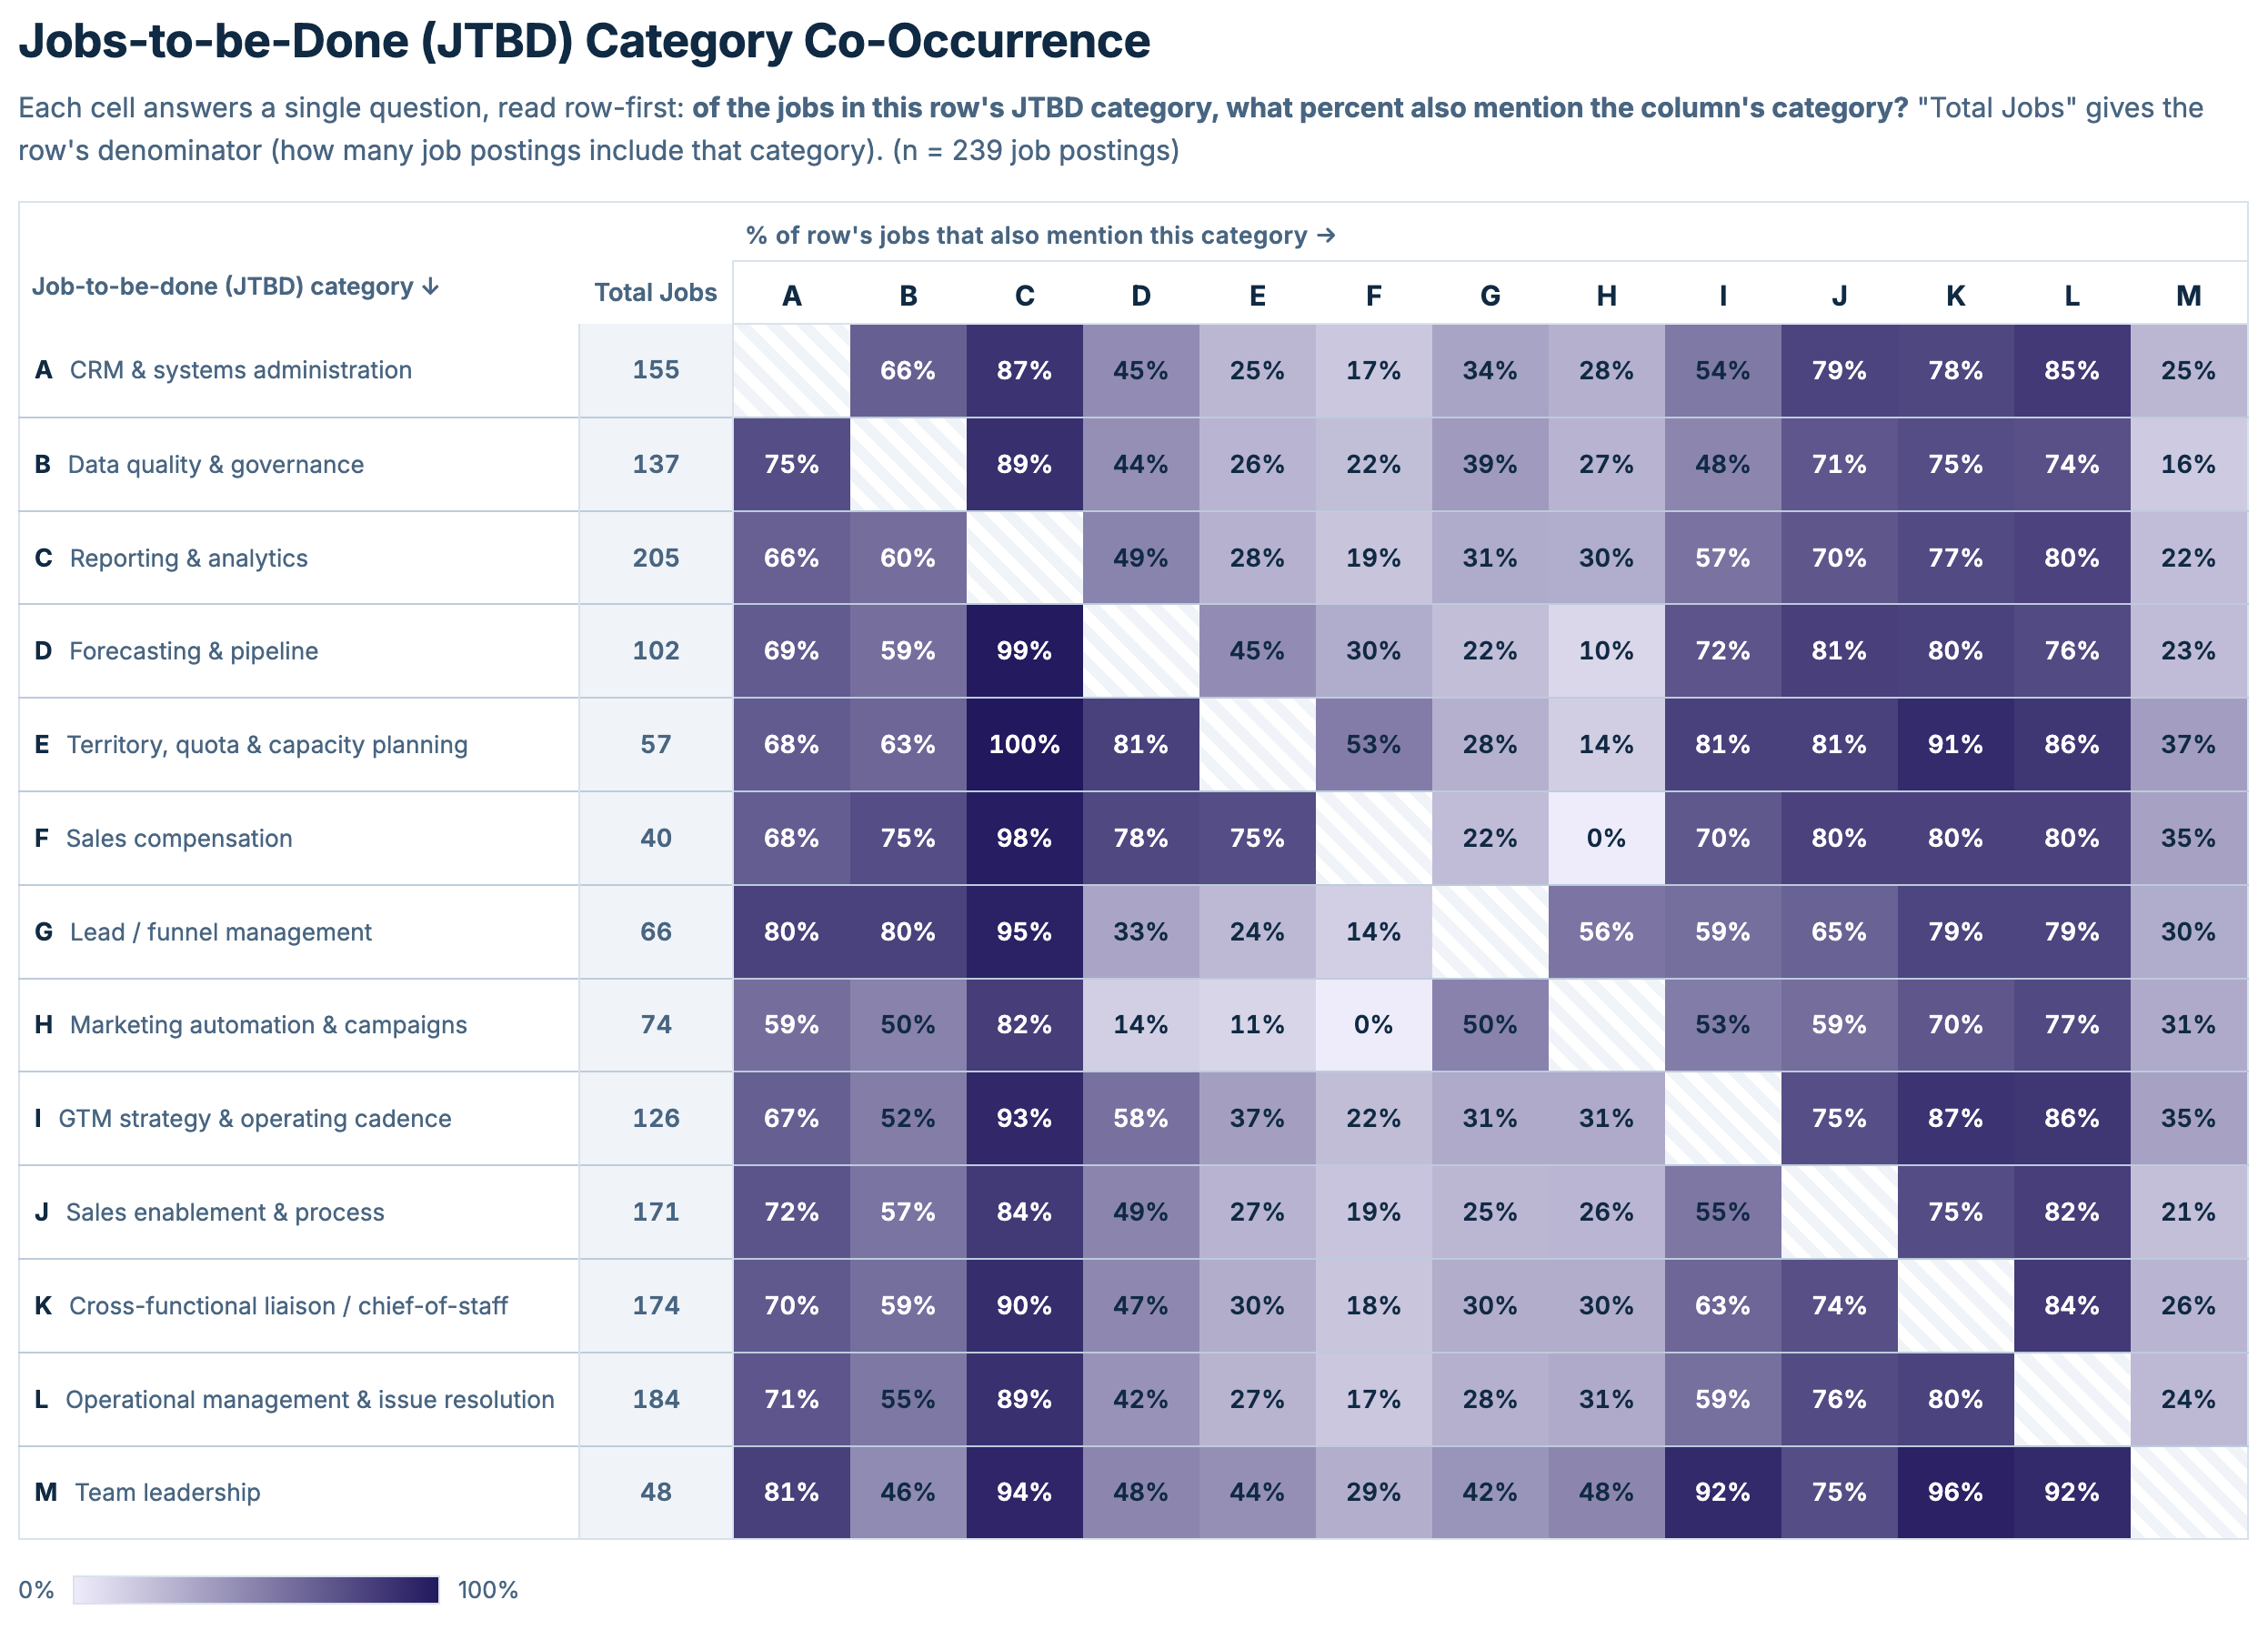
To start, you can read this row-by-row.3 For example, of the 155 job postings that mentioned CRM & Systems Administration (A), 66% also mentioned Data Quality & Governance (B). Of the 57 postings that mentioned Territory, Quota and Capacity Planning (E), 100% also mentioned Reporting & Analytics (C).
What this means is that the dark purple columns appear in almost every job post, effectively forming the foundation of the RevOps role:
Reporting & Analytics (C)
Sales Enablement & Process (J)
Cross-Functional Liaison (K)
Operational Management & Issue Resolution (L)
I gotta say, that sounds about right to me based on all the RevOps roles I know. There are, however, a few interesting details that speak to deeper specializations within the overall RevOps landscape.
One clear area of specialization is marketing ops. Roles that mention Lead / Funnel Management (G) or Marketing Automation & Campaigns (H) rarely also mention core sales operations categories like Planning (E) or Comp (F). In fact, Marketing Automations & Campaigns never overlaps with Comp and has some of the lowest co-occurrence numbers across the board.
Comp (F) appears in the smallest number of job postings and—with the exception of the MOPs categories above—has high co-occurrence with basically every other category. This indicates that it’s frequently tucked in alongside other jobs and is rarely a role on its own. Territory, Quota & Capacity Planning (E) follows a similar pattern. Not surprisingly, these two categories are related. Of the roles that mention Planning, 53% mention Comp, which is the highest relationship with Comp for any category.
Armed with a deeper understanding of the overall structure of RevOps roles, we can use that to drill into the potential exposure RevOps roles have to AI.
Scoring RevOps AI “Exposure”
This is the effort that former-a16z-partner-turned-analyst Benedict Evans called “bullshit” in the post I screenshotted earlier. Maybe he’s right, but I still found it instructive.
When I talk about a role or JTBD’s “exposure” to AI, what I really mean is: How likely is that role to be either replaced or heavily altered by AI?
To try and figure out AI exposure, I assigned each of our 66 JTBDs an AI exposure label of low, medium or high. The rubric isn’t super complex:
High - Structured system work (CRM config, querying, dedup, content production) that AI tools already do. Humans manage setup, oversight, and exception handling.
Medium - AI handles analytics or workflows, but a human owns the framing, judgment, or final decision.
Low - Stakeholder management, negotiation, strategic judgment, or people leadership. AI can help, but it can’t do the work.
I used Claude to assign the ratings to each JTBD but reviewed them manually. You can see the details in the full taxonomy. Reasonable people can disagree on the exact labels but, if anything, I felt like it was conservative.
To turn these labels into a quantitative measure, I assigned a numeric value to each: low = 0, medium = 0.5 and high = 1. With that in place, I could build an “AI Exposure Index” that ranges from 0 (minimal AI impact) to 1 (fully replaceable by AI) from a weighted average of JTBD mentions.4
Using this analysis, it’s clear some JTBD categories have way more AI exposure than others.
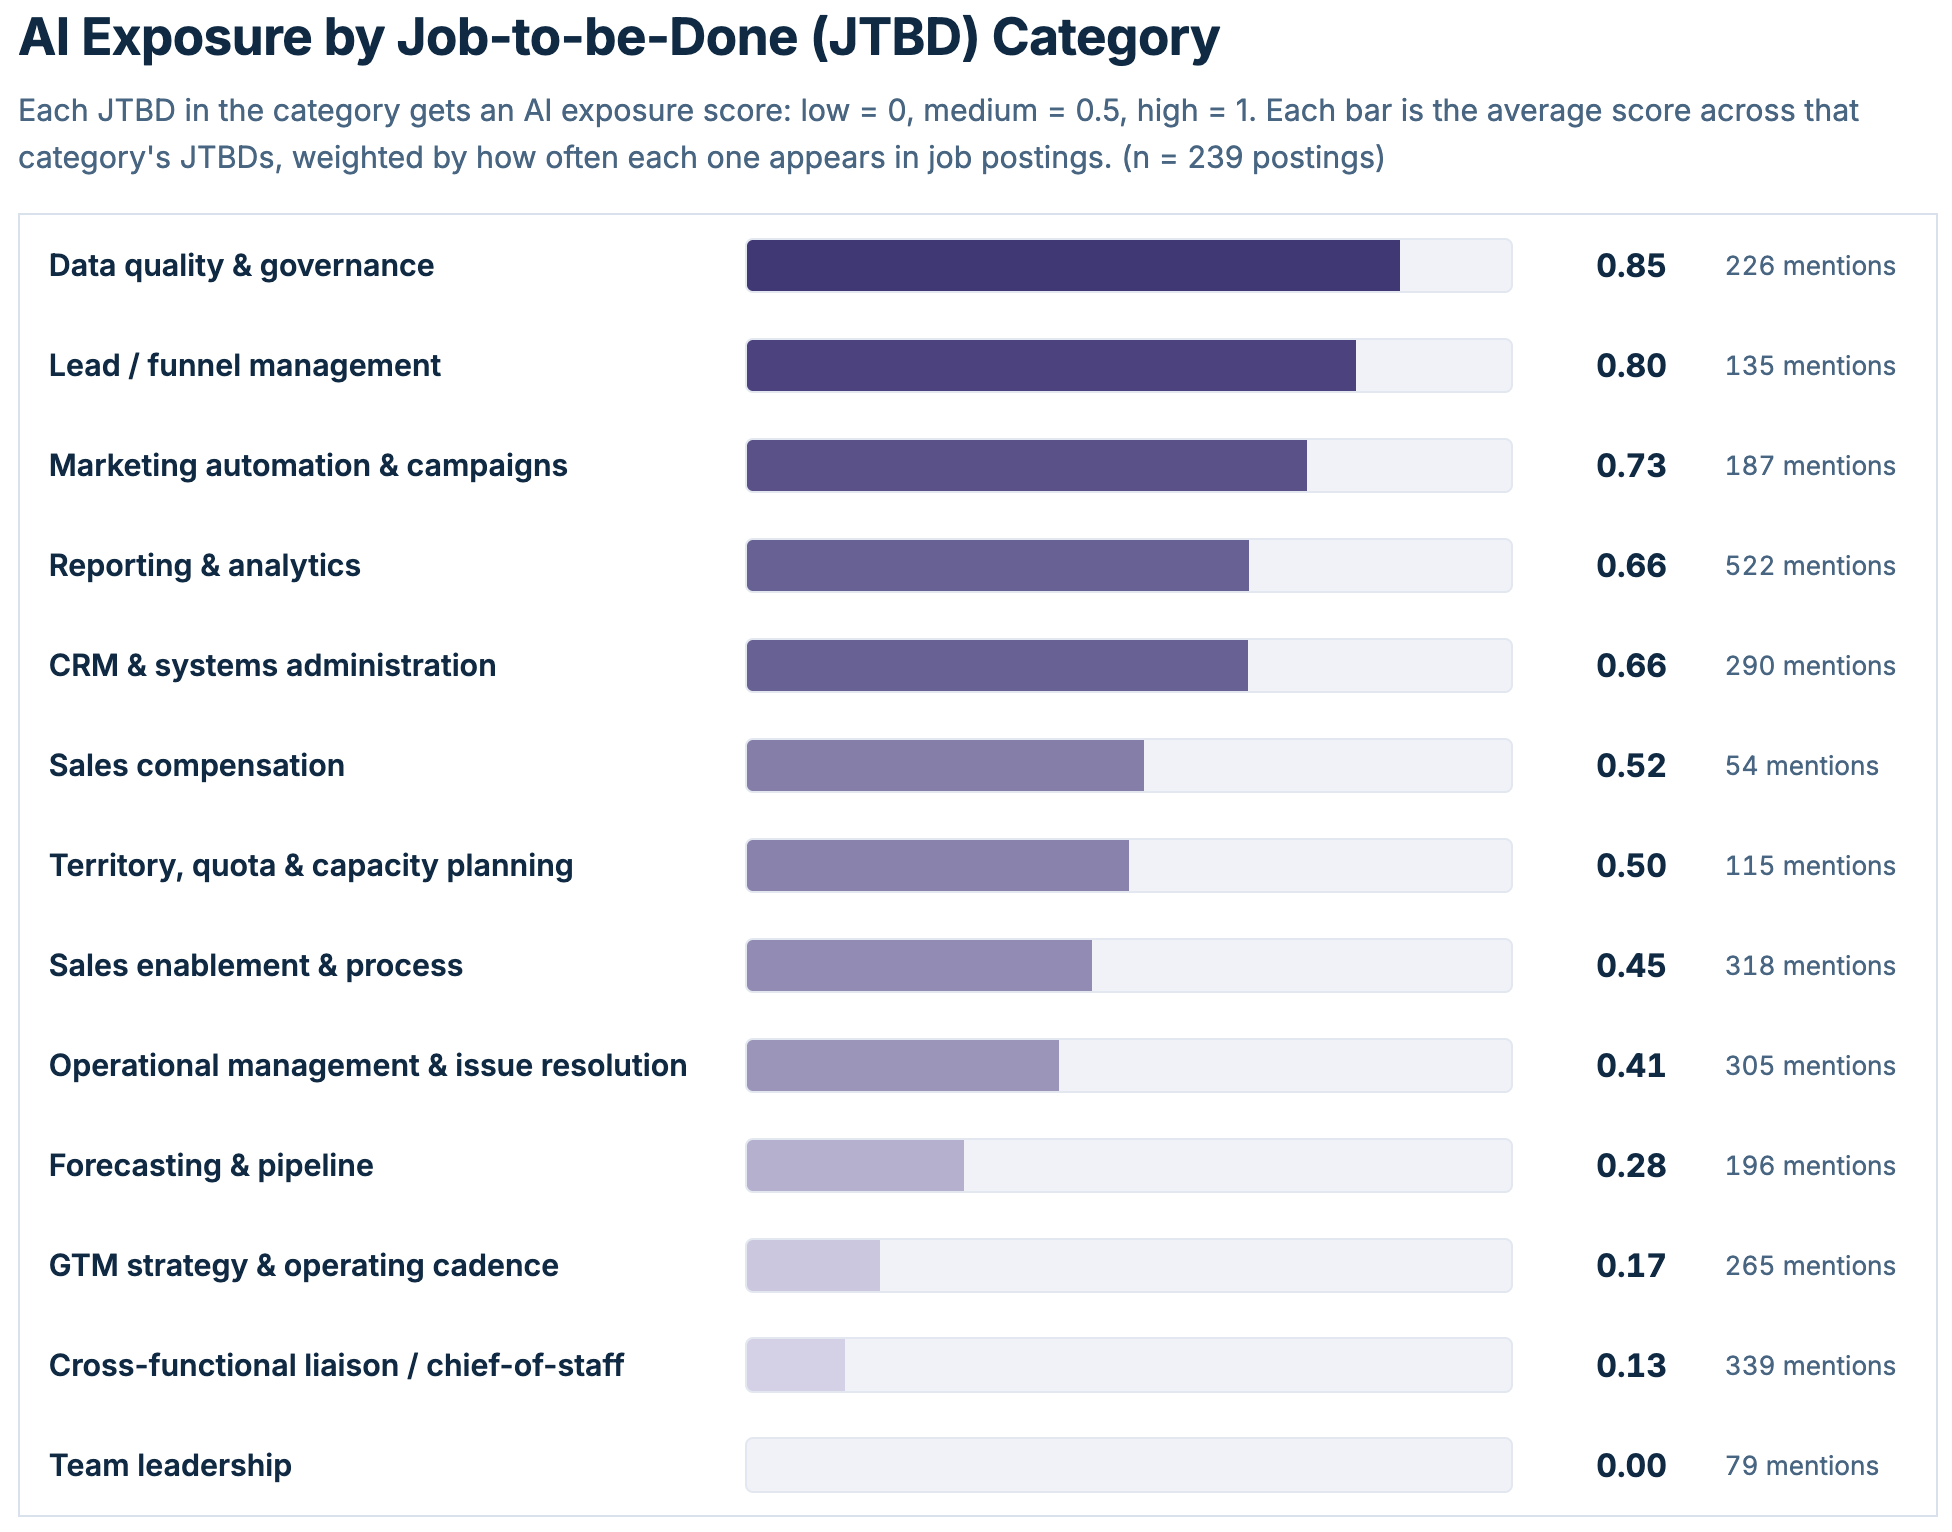
The JTBDs that are closest to pure data and workflows end up with the highest exposure. These are already heavily automated using traditional tools—AI just accelerates the process.
Data Quality & Governance leads the way. If you look at the underlying JTBDs in the taxonomy, it’s not hard to see why:
Maintain data hygiene (high) - deduplication, data normalization and lifecycle-stage cleanup are all very AI-shaped.
Define and enforce data-quality standards (medium) - defining the standards is human judgment, while enforcement (monitoring, automated remediation) is high-AI.
Reconcile data across systems (high) - structured cross-system comparisons are straightforward for AI.
Operate the GTM data acquisition & enrichment pipeline (high) - pipeline ops, vendor API orchestration, ingestion dedupe are all AI-shaped.
I was a little surprised that Reporting & Analytics didn’t end up higher on this chart. The mechanical process of fetching data and doing analysis is something AI can do easily. Deciding what to report on, how to interpret it and communicating it to stakeholders is something AI helps with but it doesn’t (yet) entirely replace a human. This article itself is probably a decent example of that.
All that said, the most common JTBD in the entire data set—Build dashboards and recurring reports—falls under this category and is very high AI exposure.
Finally, we can turn our attention to which roles are actually the most AI-exposed. To do that, I broke the data down by company size and seniority. Each cell shows the average AI Exposure score for job postings at that company size and seniority.
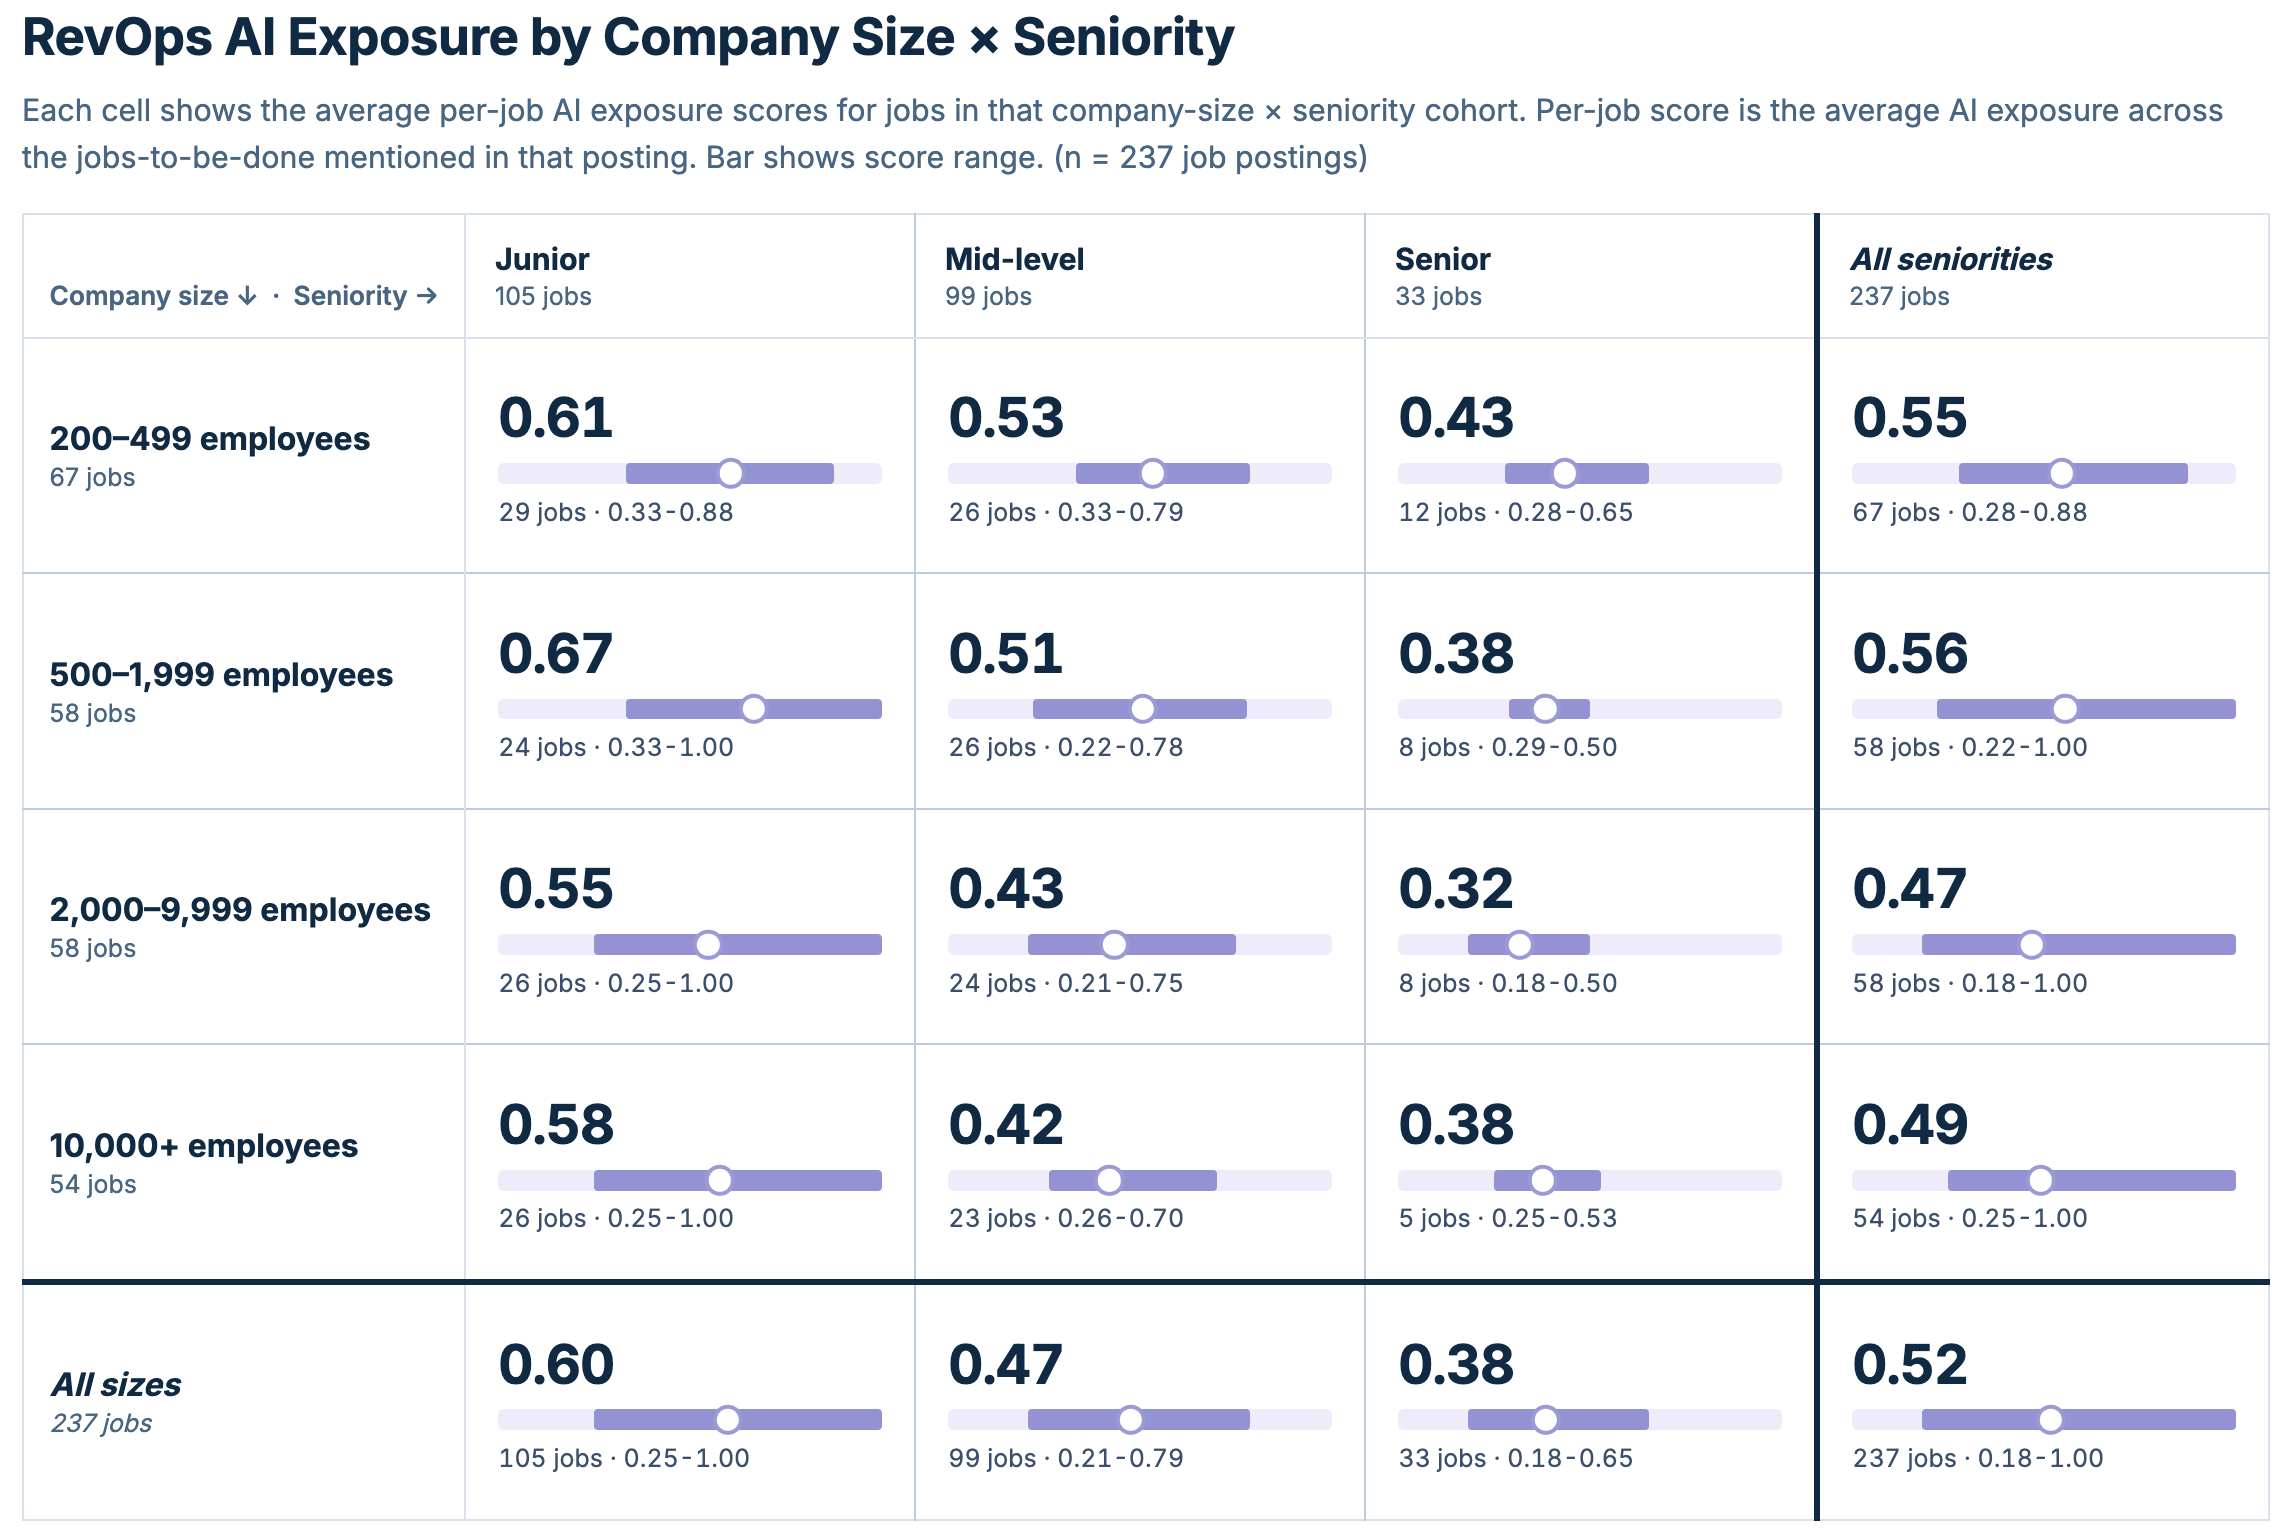
There’s a clear trend of reduced AI exposure as seniority increases.
It’s highest for junior roles—they’re doing the simplest tasks that are most closely related to data and systems. Some of those job posts even contained 100% AI-susceptible JTBDs. It’s not hard to imagine a world where there are far fewer of these kinds of roles.
Senior leaders fare significantly better. Their roles require some strategic judgment (hopefully!), meaningful resource allocation and stakeholder management. AI can help with these JTBDs, but it can’t outright replace them.
Interestingly, AI exposure tends to decrease in larger companies. My hypothesis is that this reflects the coordination overhead of larger organizations. No matter the seniority level, larger orgs require more of the job to go towards stakeholder management and cross-functional coordination—two things that have lower AI exposure.
Wrapping up
If anything, I think this analysis is too conservative. For any claim about high, medium or low AI exposure for a given JTBD, it’s best to add “right now”.
This time last year, all these values would have been significantly lower. There’s very little reason to believe that they won’t be significantly higher next year. This is a function of two things:
AI improvements - AI is now very good at the basics of accessing systems, retrieving data and doing analysis—even for complex tasks. There’s no fundamental reason to believe it won’t keep moving up the stack toward judgment, decision-making and communication.
Organizational change - If AI starts eating away at junior roles, that eats away at middle-management roles and results in smaller teams overall. If this happens across functions, human coordination overhead goes down for RevOps roles and the AI exposure goes up. It’s a self-reinforcing cycle.
I agree with Benedict Evans. It’s fair to question the methodology that goes into an analysis like this. The numbers may reflect an impossible level of precision, but the AI RevOps reckoning is very real.
Whether or not this effort is actually bullshit is an exercise for the reader.
I did a further pass to exclude jobs that were labeled “revenue operations” but that were outside the scope of GTM operations. Among other things, that meant dropping jobs with a “revenue operations” title that were focused on finance and accounting like revenue recognition or those roles that were labeled “sales operations” that were actually customer-facing.
The numbers aren’t symmetric because the denominator for each row is the number of jobs in that row.
This 0-1 scale is the same range as the one Anthropic uses in their radar charts but you shouldn’t assume they’re saying quite the same thing. Two similar, but different, methodologies.