
3 Outbound Metrics CROs Need
Simplistic measurement puts your pipeline at risk.


tl;dr - Primitive metrics make outbound pipeline a gamble—but there’s a better way:
Most sales teams rely heavily on outbound contribution to pipeline, making it a strategic priority that requires strong measurement.
Outbound metrics are too simplistic, focusing on activity inputs and pipeline outputs with few ways to measure efficiency or diagnose issues.
Three key metrics could improve outbound strategy: Account Coverage, Opportunity Creation Rate, and Incubation Period.
Read on for the full story.
Outbound contributes around half of the pipeline at most sales orgs1 yet there’s a strange lack of sophistication around something so strategically important.
For existing pipeline, there’s a strong intellectual foundation around pipeline coverage and forecasting. That’s no surprise. Delivering on the plan and providing accurate forecasts are core to the CRO’s job (or, if they fail, lack thereof).
Inbound contribution to pipeline has complex attribution models and deeply instrumented customer journeys. Again, no surprise. Marketing has spent years justifying their place in the C-suite with ways to measure brand impact and demand generation.2
Outbound, on the other hand, has… activity in and pipeline out. Most reps are given a patch, told they’re “the CEO of their territory” and sent off to hunt down prospects. If they fail, well they just need to do more activity. How many times have you heard (or said) some variation of, “It takes 100 dials to set a meeting. Every no gets you closer to that yes!”
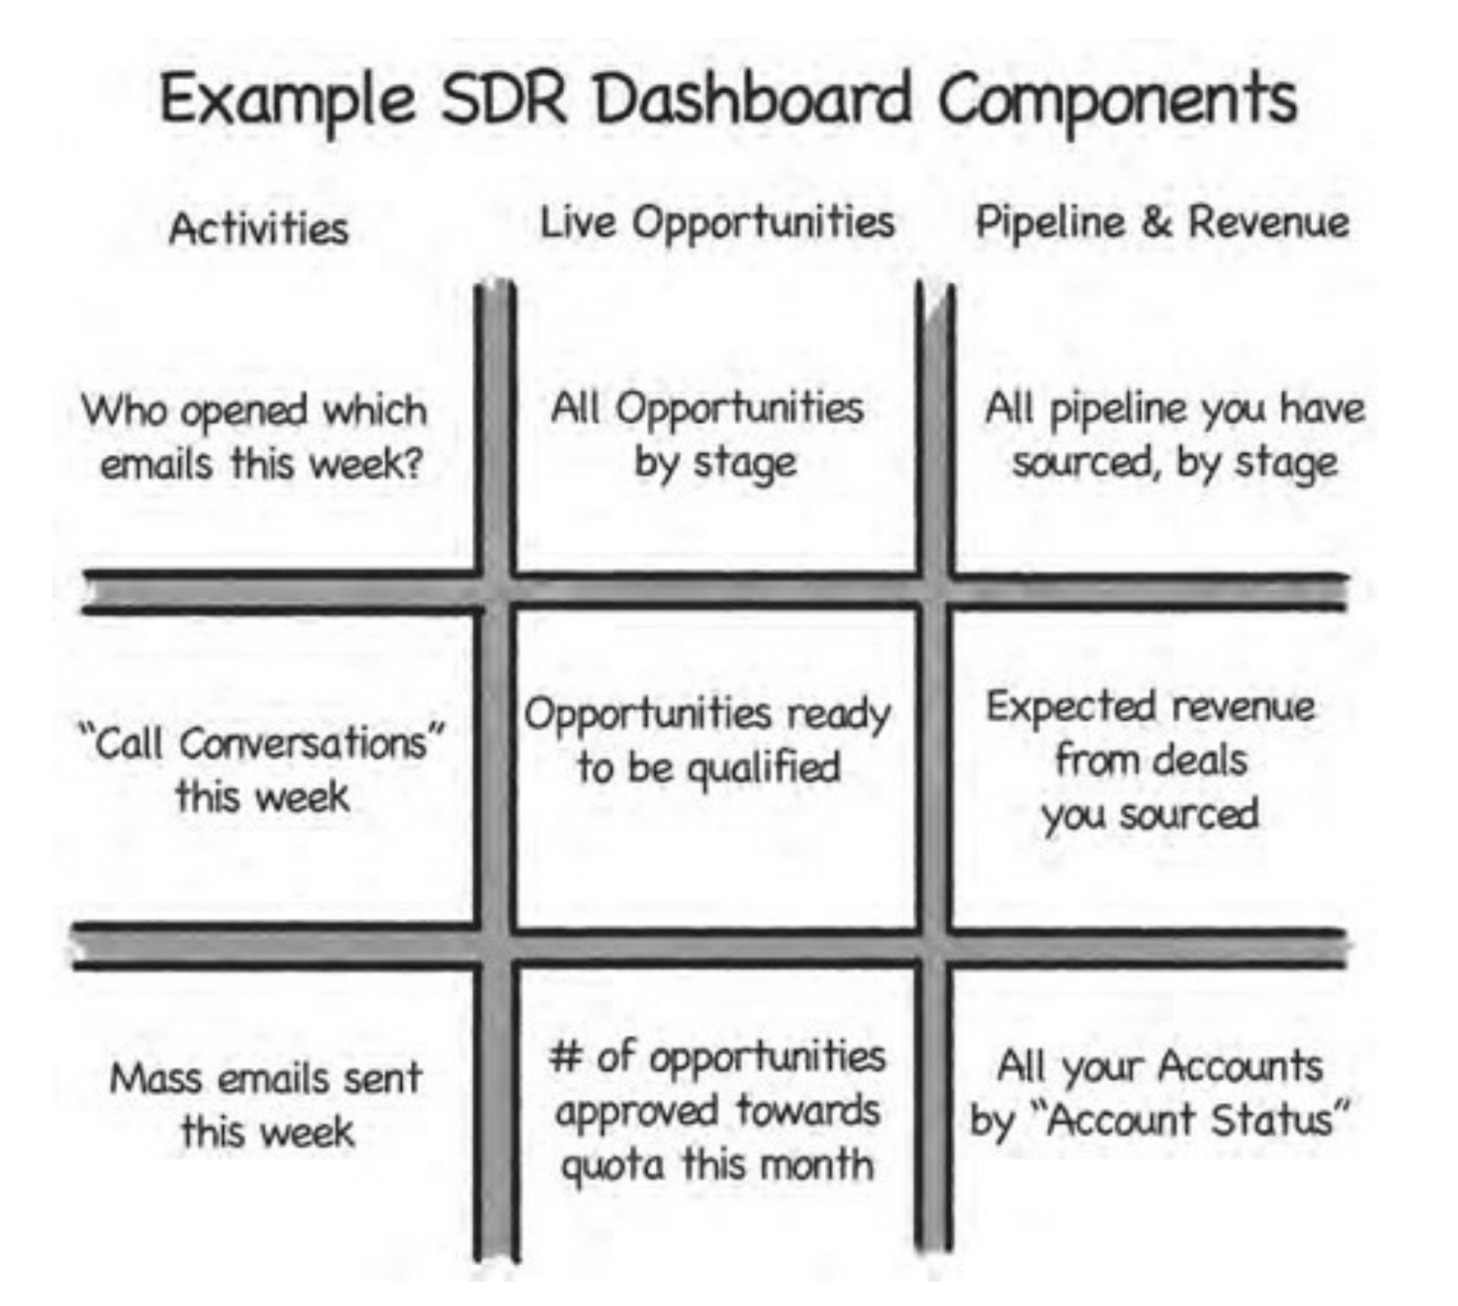
Fifteen years ago, Predictable Revenue kicked off the cult of the SDR because it treated outbound pipeline creation as a specific process instead of just one of many full-cycle AE responsibilities. The book itself says little about measurement, and what it does say is inconsistent. It says you shouldn’t track activity and instead should focus on result metrics like opportunities created. But then there’s this:
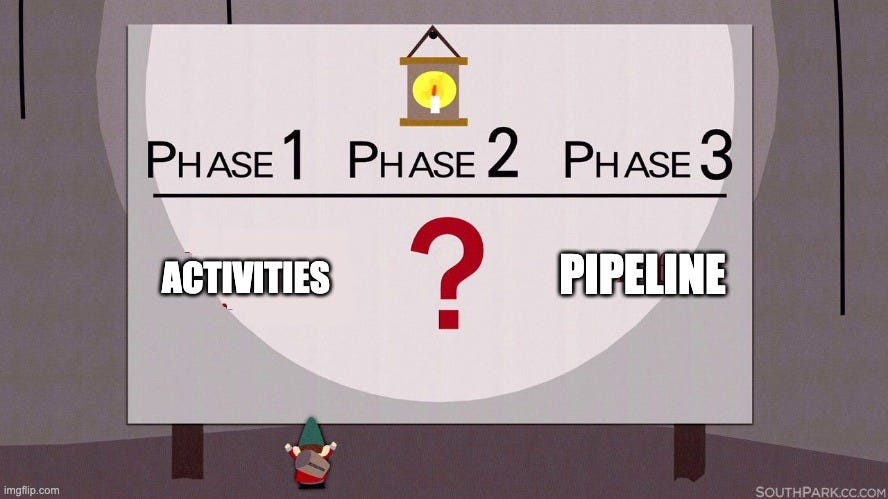
We’re already in a bit of a mess here. We do activities (which we shouldn’t measure) to generate results like opportunities/pipeline (which we should measure). What’s in the middle? Unclear. There’s a serious gap between those inputs and outputs.
It reminds me of this:
Unfortunately the situation hasn’t gotten a lot better. The current king of Very Serious Revenue Books is Revenue Architecture by Jacco van der Kooji, founder of Winning by Design. He pioneered the idea of combining both new business and account management “funnels” into “The Bowtie”.

Outbound lives in the Awareness and Education sections on the left of the bowtie but Revenue Architecture doesn’t have too much to say about outbound measurement. The book’s deepest sections are about the data model and mathematical model. Those sections include 9 mentions of inbound and only 1 mention of outbound. The lifecycle stages are even referred to as MQL and SQL, betraying the fact that this is built on the assumptions of the semi-linear marketing funnel from which the bowtie gets its shape.
It seems the Revenue Intellectuals are no help. Perhaps the practitioners will come to the rescue? Unfortunately, I asked about this on LinkedIn a couple weeks ago and got crickets. Compare this to my call for pipeline coverage information which generated 22 comments worth of recommendations and discussion.
There’s not no one thinking about this. I’ll share some thoughts below from folks I respect like Erik Huddleston and Dave Breshears. It’s also entirely possible I’ve missed some great thinkers in this area. Please tell me if I have!
The overall quality of The Discourse doesn’t seem to match the importance of the problem. In practice, most teams just measure activity as an input and pipeline as an output. In between, there are some low-level metrics like connect and reply rates that relate to channel performance. But that’s it.
This matters—a lot—because if our outputs lag while our inputs seem fine, we’ve got no meaningful way to diagnose the problem. We also don’t have reporting metrics that help us understand if our outbound teams are doing their jobs effectively.
We’re left strategically blind. There’s no way to reliably measure the source of half our pipeline—the pipeline on which our whole plan hinges.
Maybe that can change. Below are three metrics that I believe would help uplevel the strategic discussion around outbound:
Account Coverage - percent of accounts in a segment engaged during a specific period (“Are we working the right accounts?”)
Opportunity Creation Rate - percent of engaged accounts where engagement results in an opportunity (“How efficiently do we turn prospects into opportunity?”)
Incubation Period - time from account assignment to meeting set (“How fast do we turn effort into opportunity?”)
Let’s dig in.
Account Coverage
Quick! What percent of ICP accounts have your reps engaged in the last 6 months? Unless you’re selling to a very small list, you probably can’t answer that, mostly because there are likely thousands of accounts you don’t even know exist yet.
The problem is most people can’t really answer even for the accounts that are in CRM. I’d bet more could quote how many dials and emails their reps do on a daily basis.
We measure outbound activity, but rarely where that activity is applied. It’s a bit like awarding the NBA MVP to the player that runs the most miles on the court during the season. Lots of effort; unclear if it’s correctly applied.
Account coverage is straightforward way to look at that problem. Pick a minimum engagement level (e.g. 3 touches), period (e.g. last quarter) and a segment (e.g. mid-market). Count how many accounts actually received that level of engagement during the period. Express that as a percentage of total accounts in that segment.
Strategically it tells you if your team’s actually working the accounts you intend them to. You’d be surprised how often reps aren’t really executing the strategy and are off working the account their cousin’s best friend’s sister just got an AE role at.
Like I said, it’s mathematically simple. It barely deserves the fancy equation treatment, but here it is:
Ne = number of engaged accounts
N = total number of accounts
At Gradient Works, we often do a coverage analysis for teams considering our pipeline platform. We typically use a year’s worth of account and activity data and show account coverage as a series of heatmaps (aka an “Engagement Grid”) using two different dimensions. I like this view because it immediately shows coverage gaps.

In the e-commerce software example above you can see that only 30% of accounts with ≤$10M in GMV in the grocery industry have been worked. If that’s an important segment, it should set off alarm bells.
You don’t need the fancy heatmap, you can just calculate a number for any group of accounts:
Books - measure how much of their book/territory reps actually cover. If it’s low, they may be doing a bad job or may simply have too many accounts. I’ve written about this and so has Dave Breshears.
ICP - identify when reps aren’t engaging with the most important accounts in your market. This is where you’re leaving money on the table.
Market Expansion - when you ask reps to do something different (e.g. sell to larger companies or focus on a new industry), you’ll often find they’re staying put in the areas they know. Account coverage shows what’s really going on.
Opportunity Creation Rate
Let’s go back to the idea of opportunity creation as the outcome of activity alone: “It takes 100 dials to set a meeting.”
It’s not wrong, but it’s inadequate. It starts from the premise of turning activity directly into meetings when B2B outbound is about applying activity to turn accounts into meetings.
All activities aren’t created equal. It’s obvious that 100 activities on one account could only yield a maximum of 1 opportunity and 100 activities on 100 accounts could possibly yield up to 100 opportunities. (I wouldn’t necessarily recommend either approach, for what it’s worth.)
As account coverage shows, the distribution of effort across accounts matters. You also need to understand how well that engagement works to create opportunities—that’s opportunity creation rate. Strategically, this tells you how efficiently you’re turning your accounts (which are a consumable resource) into opportunity.
It’s also very simple:
No - Number of accounts with a created opportunity
Ne - Number of engaged accounts (as you’ve chosen to define engagement, e.g. 3 touches over some period)
Like account coverage, you can apply this to any group of accounts. For example, if you have account Segment A with a 20% opportunity creation rate and Segment B with a 10% opportunity creation rate, you can say that Segment A twice as good for outbound efficiency (assuming the same reps and messaging).3
You can also use it to compare teams (or reps) to each other to identify gaps. If Team A and Team B have similar books but one has a better opportunity creation rate, you can be pretty sure you have a skill or activity issue.
The better your opportunity creation rate, the more efficient your outbound engine is and the more you can scale it with headcount. Team A with a 1% opportunity creation rate will need 100 workable accounts for every opportunity created. Team B with a 10% opportunity creation rate only needs 10 accounts. Team B could “feed” 10x the headcount of Team A with the same number of accounts.
Incubation Period
All credit for this metric goes to Erik Huddleston, one of the best operators I know. He’s a huge proponent of reducing “cycle time”—making every part of the business operate faster. Pipeline creation is no different, and incubation period is how he drives cycle time there.
Incubation period measures the amount of time (usually days) it takes to engage an account before setting a meeting. It can be expressed as an average, or better yet, as a median.
Strategically it tells you how quickly you can generate pipeline from outbound. Put differently, it shows what kind of lead time to expect from an outbound effort before it yields pipeline.
Here’s how it looks as an average:
Ct = Opportunity creation date/time
At = Account assignment date/time (more on that in a second)
Σ = Sum those up for each account with an opportunity
No = Number of accounts with opportunities in the period
The At term needs a little more explanation. This is when the clock starts ticking. In a dynamic books model where accounts are assigned frequently, this starts at actual account assignment time.
If you’re using a static territory model you can choose to measure it from first engagement with an account after territory assignment. However, think about what this actually means. If you assign an account on January 1st and the rep doesn’t touch it until July 1st, you’re implicitly saying it’s ok to add 6 months to the true incubation period for that account. That’s not great for cycle time.
Aside from giving you visibility into the lag between account assignment and pipeline creation, you can use this in myriad ways:
Urgency - shrinking the incubation period speeds up the velocity of your entire revenue engine. The faster you create pipeline, the faster you make money
Rep Diagnostics - large variations between reps helps identify skill gaps
Segment Comparison - large variations between different account segments could mean you need segment-specific messaging or tactics
Channel Velocity - this same metric can be applied to inbound (first indication of awareness to meeting set), allowing you to compare velocity across channels
Wrapping up
Outbound is too important to be left with simplistic activity counts and connect rates. These three metrics give us much more visibility:
Account Coverage - “Are we working the right accounts?”
Opportunity Creation Rate - “How efficiently do we turn prospects into opportunity?”
Incubation Period - “How fast do we turn effort into opportunity?”
It’s high time we develop a more sophisticated way of diagnosing problems and measuring efficiency with outbound. Half your pipeline depends on it—it’s hard to think of much that’s more strategic than that.
CMOs have done the work to demonstrate their value even though they don’t know which half of the money they’re wasting.
Whether it’s actually better for the business is another question. Segment B could have 5x the win rate and 2x the ACV of Segment A, in which case you should spend more time in Segment B and try to improve efficiency there.