
The Tao of the TAL
Building and improving target accounts lists for H2.


When my wife was getting her PhD at UT long ago, one of her fellow social scientists made a joke about autoethnography. As a simple country computer scientist, it went over my head.1 The gist was that sharing your personal experiences and connecting them to some larger narrative is just a cheap way to get a publication. (I didn’t say it was funny.)
Well guess what, dear reader? It’s time for an autoethnography.
July is the unofficial start of Adjustment Season2 on the sales calendar. Right on schedule, most of my customer and prospect conversations the past couple weeks have involved reassessing account strategy—mostly refinements to account scores, territory refreshes or updates to the assignment criteria that drive dynamic books. Some are big shifts; most are are small changes.
We’re doing the same thing at Gradient Works. I celebrated the long July 4th weekend by digging into our Target Account List (TAL) strategy from the first half of the year.
It turns out we got a lot wrong, but we got a lot more right. At the beginning of the year we went all in on a list of 6303 target accounts. Our reward? A tough Q1 as we rebuilt a higher quality pipeline, but we followed that up with a record Q2. Now we’re entering Q3 with the healthiest pipeline we’ve ever had.
Focus on the right accounts and pipeline starts clicking into place. Who knew?4
I thought I’d use this as an opportunity share our experience: why we felt this narrow TAL was necessary, how we did it, how we’re evaluating performance and what we’re changing. Hopefully, our successes and failures will give you some ideas for your own H2 tweaks.
Why we needed a TAL in 2025
In 2024, we tried to cover a lot of ground. We loosened up the ICP a bit and tried to create a blend of small-but-fast deals along with slow-but-large deals. We spread ourselves too thin. Sales cycles were too long on the small side and ACVs weren’t high enough on the larger side. Definitely not the best of both worlds.
Heading into 2025, we knew we needed to focus only on prospects that truly needed our whole platform. We believed two things:
Our prospects are drowning in generic cold outbound. The only effective outbound has ridiculously relevant messaging tailored to the exact person who’s receiving it—and no one else.
Our marketing budget is limited. Every dollar needs to help reach exactly those people who have the problems we solve.
The best way to achieve this was to go all-in on a small list of highly qualified accounts. Thus the TAL.
How we built the TAL
First, a word of advice. Unless you have reams of historical data, every ICP decision you make is going to eventually hinge on intuition, domain expertise and common sense. This isn’t particle physics—there’s no 5σ statistical significance in sales. Don’t make a decision without data, but don’t expect data to make your decisions for you.
With that in mind, here’s how we used data to help create our TAL.
A target account list needs to be filled with the best ICP fits you can find. So, we started with the 3+1 ICP framework to refine our ICP criteria:
Every B2B company has the same 3 core ICP dimensions: size, geography and industry. They’re easy to acquire, have common definitions and are easy to operationalize.
Then every company adds 1 (or more) additional factors that are unique to their business. These are are often uncommon, possibly even unknowable or extremely subjective.
Let’s look at our specific version of the core 3 and the +1s.
The core 3
We started with ~10k accounts in our Salesforce. We did a first pass enrichment of basic firmographics for those accounts with ZoomInfo. We knew we weren’t building a massive list so we didn’t import any new accounts—the focus was on stack-ranking the ones we already had.
Geography was easy. We focused on companies HQ’d in English-speaking countries. That meant the US, Canada, UK and Australia. We also included Israel because ~85% of the population speaks English and they have an outsized share of successful B2B SaaS companies. While we incorporated the other countries, the final list was heavily biased toward the US which was good for timezone reasons.
For overall company size, we analyzed 12 months of opportunity data looking at win rates, sales cycle lengths and ACV broken out by total employee count.
Bigger companies were better, but not by as much as you’d think. It was, however, pretty clear we should avoid companies with < 200 employees. We also wanted to set an upper threshold because at a certain point more size just creates diminishing returns on sales effort. We settled on 2,500 employees as the upper end. There’s no magic to this number—just reasonable intuition.
Finally, industry. We used Market Map in lieu of traditional NAICS or SIC codes. We gave it our customers as “reference accounts”. It uses AI to build a map of nuanced micro-verticals across all of our prospects and scores each one based on similarity to those customers.
You can see part of our Market Map visualized below:
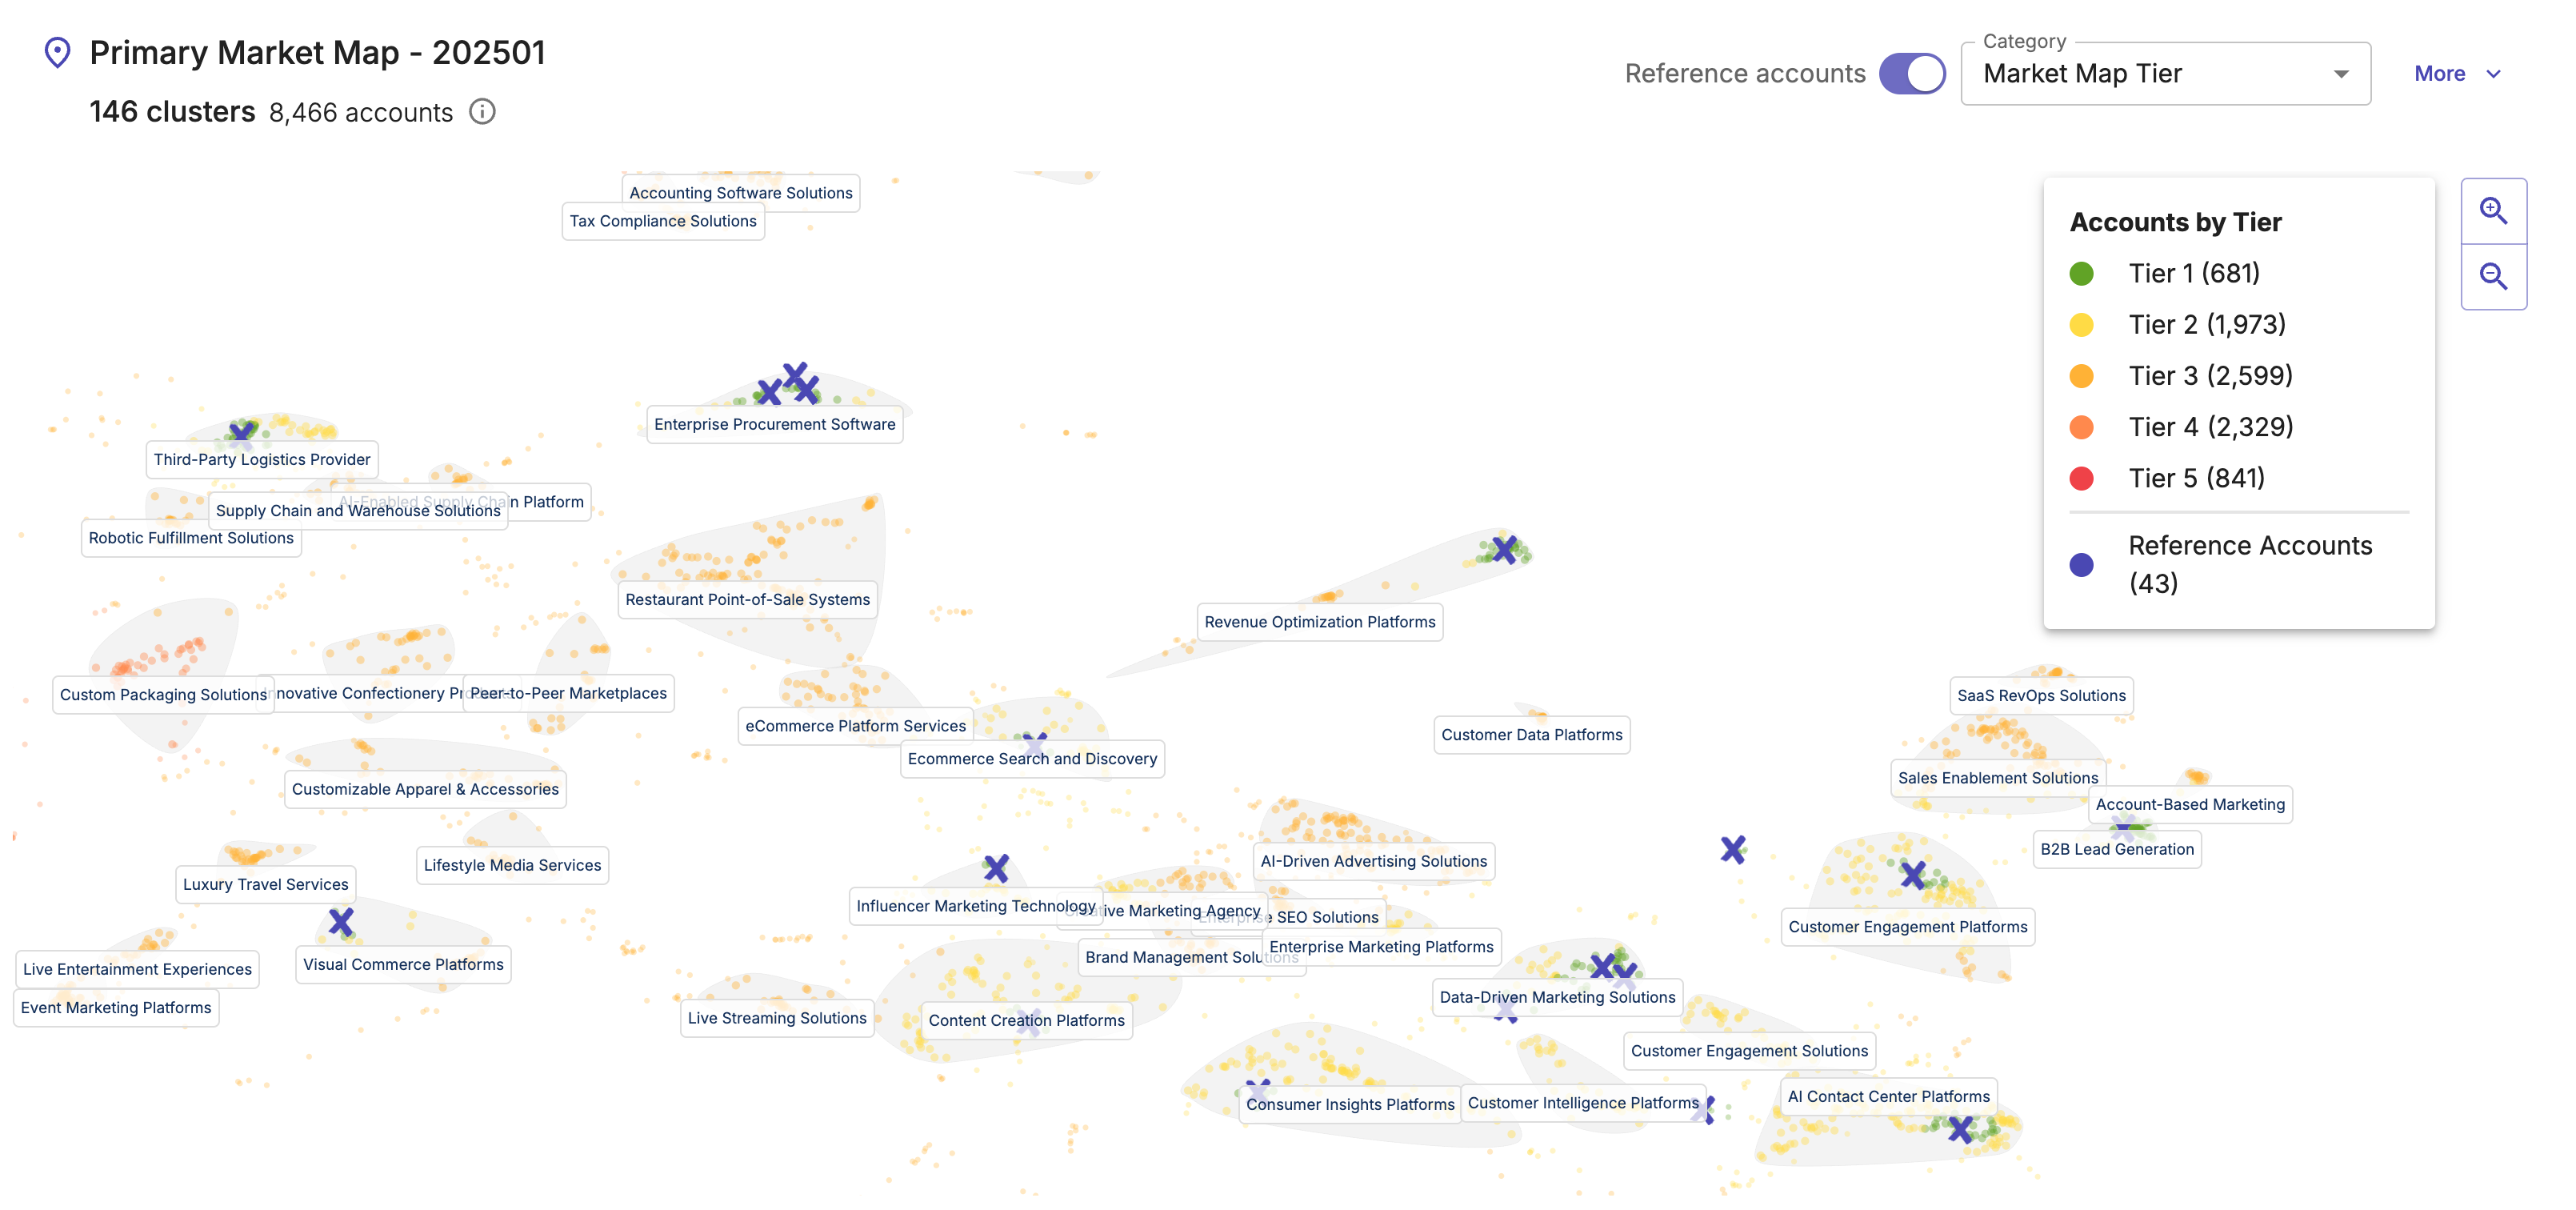
Accounts that fall into Tier 1 and Tier 2 operate in very similar industry spaces to existing customers. We used this as our cutoff.
With the core 3 out of the way, let’s look at our +1s.
The +1s
Since the core 3 are standard, the creativity comes when choosing your small set of +1s. Here are ours and why we chose them:
Commercial Sales Team Size - Gradient Works helps teams of reps working large numbers of accounts generate more pipeline. That means we focus on companies with sizable teams of commercial (SMB or mid-market) sales reps.
B2B Software - Regardless of the industry they sell to, we do best with companies selling B2B software because they usually have large tech-enabled inside sales teams.
Salesforce - We can’t sell the whole platform to companies on other CRMs because a big part of our offering is a managed package.
Finding out if they use Salesforce was easy. There are plenty of technographic sources out there. This one is super common and doesn’t change often. No need for anything beyond ZoomInfo, though we’ll use SalesIntel going forward.
B2B Software was also a pretty straightforward application of AI. Market Map gets us nearly there but we wanted to eliminate companies that offer custom software, consulting services or that target consumers. Luckily this is pretty easy to do with an AI research agent. We used our own AI Researcher but you can certainly use Clay or roll your own with something like n8n.
Finally, we get to the most challenging one—commercial sales team size. Spoiler alert: this one was far from perfect.
We already knew from experience that we wanted to focus on companies with at least 20 reps. The trick was enriching this data.
The issue is that sales roles are fuzzy and titles are even worse. Sometimes a “business development” title means someone that does outbound, sometimes it’s someone doing partnerships. No SMB rep really wants to be known as an SMB rep—they’re an “account specialist”. It gets worse from there.
Even if you can technically scrape a bunch of titles at a company, AI will still struggle to make sense of the mess. We opted for a compromise. We used ZoomInfo to find accounts with various SMB and Mid-Market titles and flagged the account as likely to have commercial roles. We left trying to figure out the number of commercial reps to manual research.
Putting it all together
To recap, here’s what we ended up with:
Size: 200 - 2,500 employees
Geo: US, CA, UK, Australia or Israel
Industry: Tier 1 or 2 in Market Map
+1s:
20+ commercial new business sales reps
B2B software
Uses Salesforce
Once all this data was in Salesforce, we built a simple formula that gave accounts a score between 0 and 100. It wasn’t super sophisticated and I won’t bore you with the math5. We basically weighted employee count and Market Map such that they made up about 70% of the score. The rest of it comes from the +1s. Accounts where we know for sure that they don’t have a required attribute get automatically scored at 0.
In the end we had about 630 accounts that scored at least a 50 or higher. And that was our TAL.
Then we got to work. Let’s see what we learned.
What we learned
Did we succeed? Well, the record results speak for themselves. We also had a 7% opportunity creation rate working these TAL accounts, which is strong efficiency. We can at least give ourselves a small pat on the back.
But it wasn’t all sunshine and rainbows. We did all that work and the team actually disqualified about 40% of the list. Oof.
DQs are a gift
First, let me explain what I mean by disqualification.
We use dynamic books instead of traditional territories or named accounts. This includes a structured account disposition process. As reps work accounts, they can return them to the account pool if they believe they can’t make progress with the account.
In some cases, reps may recommend that the account be disqualified entirely because something fundamental has changed (e.g. it’s been acquired) or the rep discovers the account doesn’t meet ICP criteria once they start engaging.
These disqualification reasons are an incredible way to learn. In our case, we learned a lot about where we struggled to properly qualify TAL accounts. See the chart below:
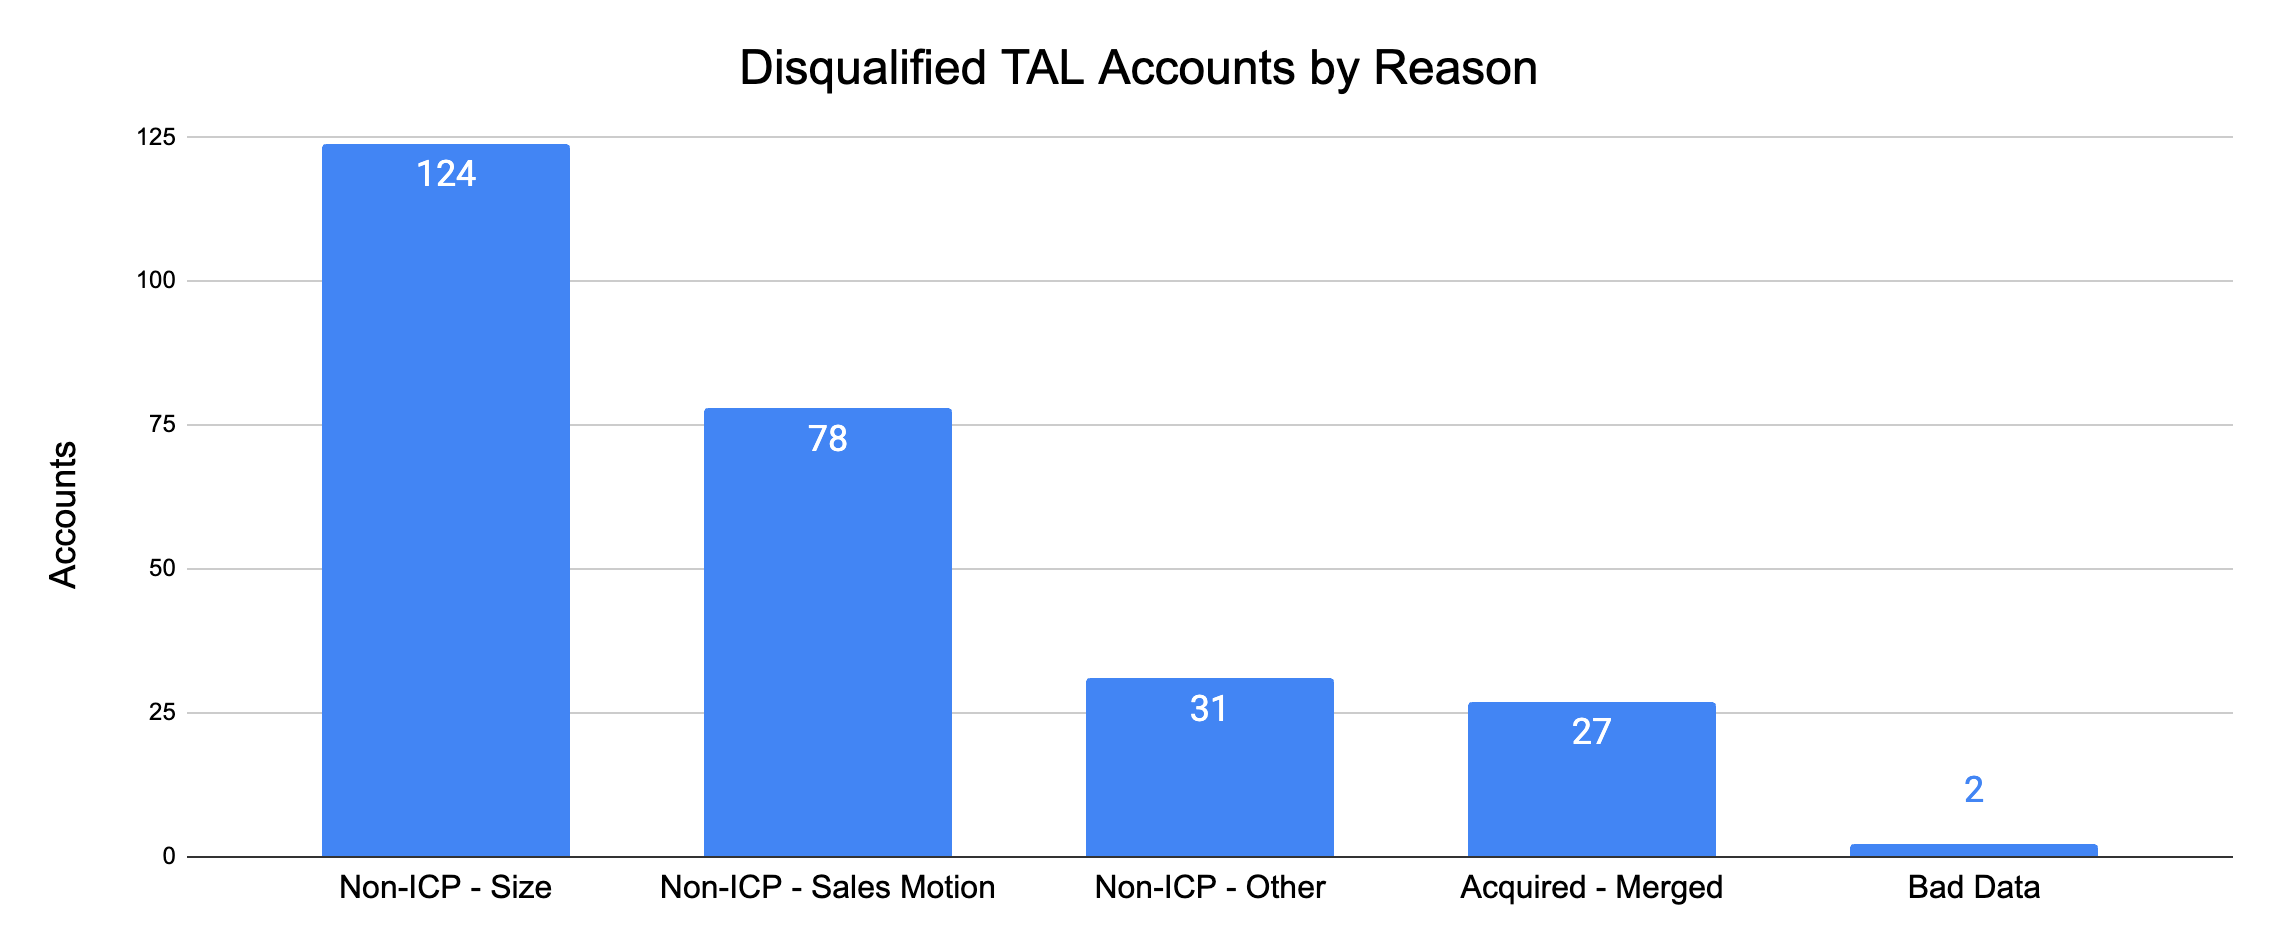
The story here is pretty clear—evaluating commercial sales teams is tricky.
We missed way too often on the size of the commercial team. While we occasionally had some bad employee count data, the commercial team was the biggest reason for size-based disqualification. Most of these did have a commercial sales motion, but that team was too small.
The next biggest source of problems was being wrong about whether there was a commercial sales motion at all. There’s a little nuance with this one. Specifically we chose to disqualify accounts that had some commercial reps, but where those reps were primarily located in a low cost country outside the US.
As for our “Non-ICP - Other” category, this included accounts that didn’t meet some other ICP criteria. For example, some didn’t quite fit the bill for B2B software. This scenario mostly involved edge cases like online marketplaces with some B2B offerings (e.g. ads or data businesses). In those cases the B2B portion wasn’t substantial enough to pursue.
The DQ data has been the most useful so far, but there are a few other takeaways as well.
Some other takeaways
Our personas (senior sales and RevOps leaders) are right. We didn’t need to change our target personas to get better results. We just needed to make sure the actual people inhabiting those personas worked at accounts where they have the right kinds of problems.
Timing matters a bit for us, but fit matters more. Our business doesn’t need super-granular timing signals. Pipeline creation is an evergreen problem and we know territory plans align with fiscal year.
Fewer accounts did result in better messaging (with one caveat). We worked a few accounts at a time with highly-tailored messaging. In particular, our deeply-researched first touch got a ton of unsolicited positive feedback—more than I’ve ever seen. However, it worked better for sales than RevOps. That’s an area for improvement.
So, where do we go from here in H2?
What’s next?
The good news is our H2 adjustments are more tweaks than overhauls. We’ll drop the DQ’d TAL accounts and look to replace them with accounts more similar to the remaining ones.
We plan to revise our Market Map. I didn’t discuss it here but we’ve been doing a detailed analysis to see which of our opportunities were truly well-qualified in the last 12 months. We’ll include companies that had well-qualified opportunities alongside customers as reference accounts in our Market Map. That should pull in more high-quality lookalikes.
We’ll also go deeper on the commercial sales team roles. In particular, we might do better by starting from total sales team size and subtracting out those roles that are clearly enterprise- or strategic-focused. Those reps are much more likely to self-identify than SMB and mid-market reps. I expect to do much more scraping and AI classification here.
I’ll report back with another TAL-based autoethnography in 6 months. In the meantime, I hope our TAL journey helps you with your own account strategy.
Why do I even remember this more than 15 years later? I guess I don’t like not getting jokes.
Are we still doing SZN?
We don’t necessarily sell the exact same way our customers do. Our customers typically have commercial teams targeting 10k+ or even 100k+ accounts. That said, the principle is the same: focus wins. The idea behind dynamic books is to narrow 100k accounts down to the few hundred that make the most impact at any given time.
Me. I knew. And yet.
If you’re genuinely interested, let me know and I’ll share it.