
Why the 10x Sales Rep Won't Happen*
*According to the people that yelled at me on LinkedIn.


This post is a little shorter than usual because it’s board meeting week for me. As I was preparing, I kept thinking about the advice Ryan Burke and Steve Travaglini shared about quarterly transitions. It’s worth a watch.
Last week I did a thought experiment about how a mid-market rep could succeed with a $10M quota. I called it The 10x Sales Rep.1 For the rest of this post to make any sense, you’re probably going to need to read that post.
If you really don’t want to read it, the gist is that I looked at 3 different scenarios to get to a $10M quota for this rep: increase volume, increase efficiency or increase ACV. The efficiency play wasn’t completely outside the realm of possibility and seems to be the most likely path to achieve 10x. Here it is in spreadsheet form:

I posted about it on LinkedIn and, well, it got the people going. 300k+ impressions, 400+ reactions and 150+ comments later, I learned what people thought of the exercise itself, the assumptions in the model and AI’s potential to transform sales. I also learned from many people—in many different ways—that I’m full of shit.
I said something provocative on LinkedIn and got a bunch of skeptical comments. I’ll refrain from being shocked. Play stupid games, win stupid prizes. All joking aside, most of the comments were actually thoughtful and offered constructive feedback. There was even very little AI slop.
And their skepticism is warranted! I was incredibly skeptical going into the exercise and remain slightly skeptical.
Given all that, I thought I’d use today’s post to do something else I’ve long thought was impossible: learn something from a comment section on the internet.
Feedback is a gift
Step one was to categorize the feedback into overall topics. I scraped the comments from LinkedIn and used ChatGPT to help identify common topics. (See the coda at the end of this post for more detail on the process if you’re into that sort of thing.)
After putting each comment in a category (again with ChatGPT), I did a little pivot to count up the comments and the likes on those comments. I figured that a like on a comment is basically a vote for the importance of that comment, so it made sense to include that as well. The combination of comments and their likes gives us a rough activity/popularity metric to use for sorting the topics. Here’s the result:
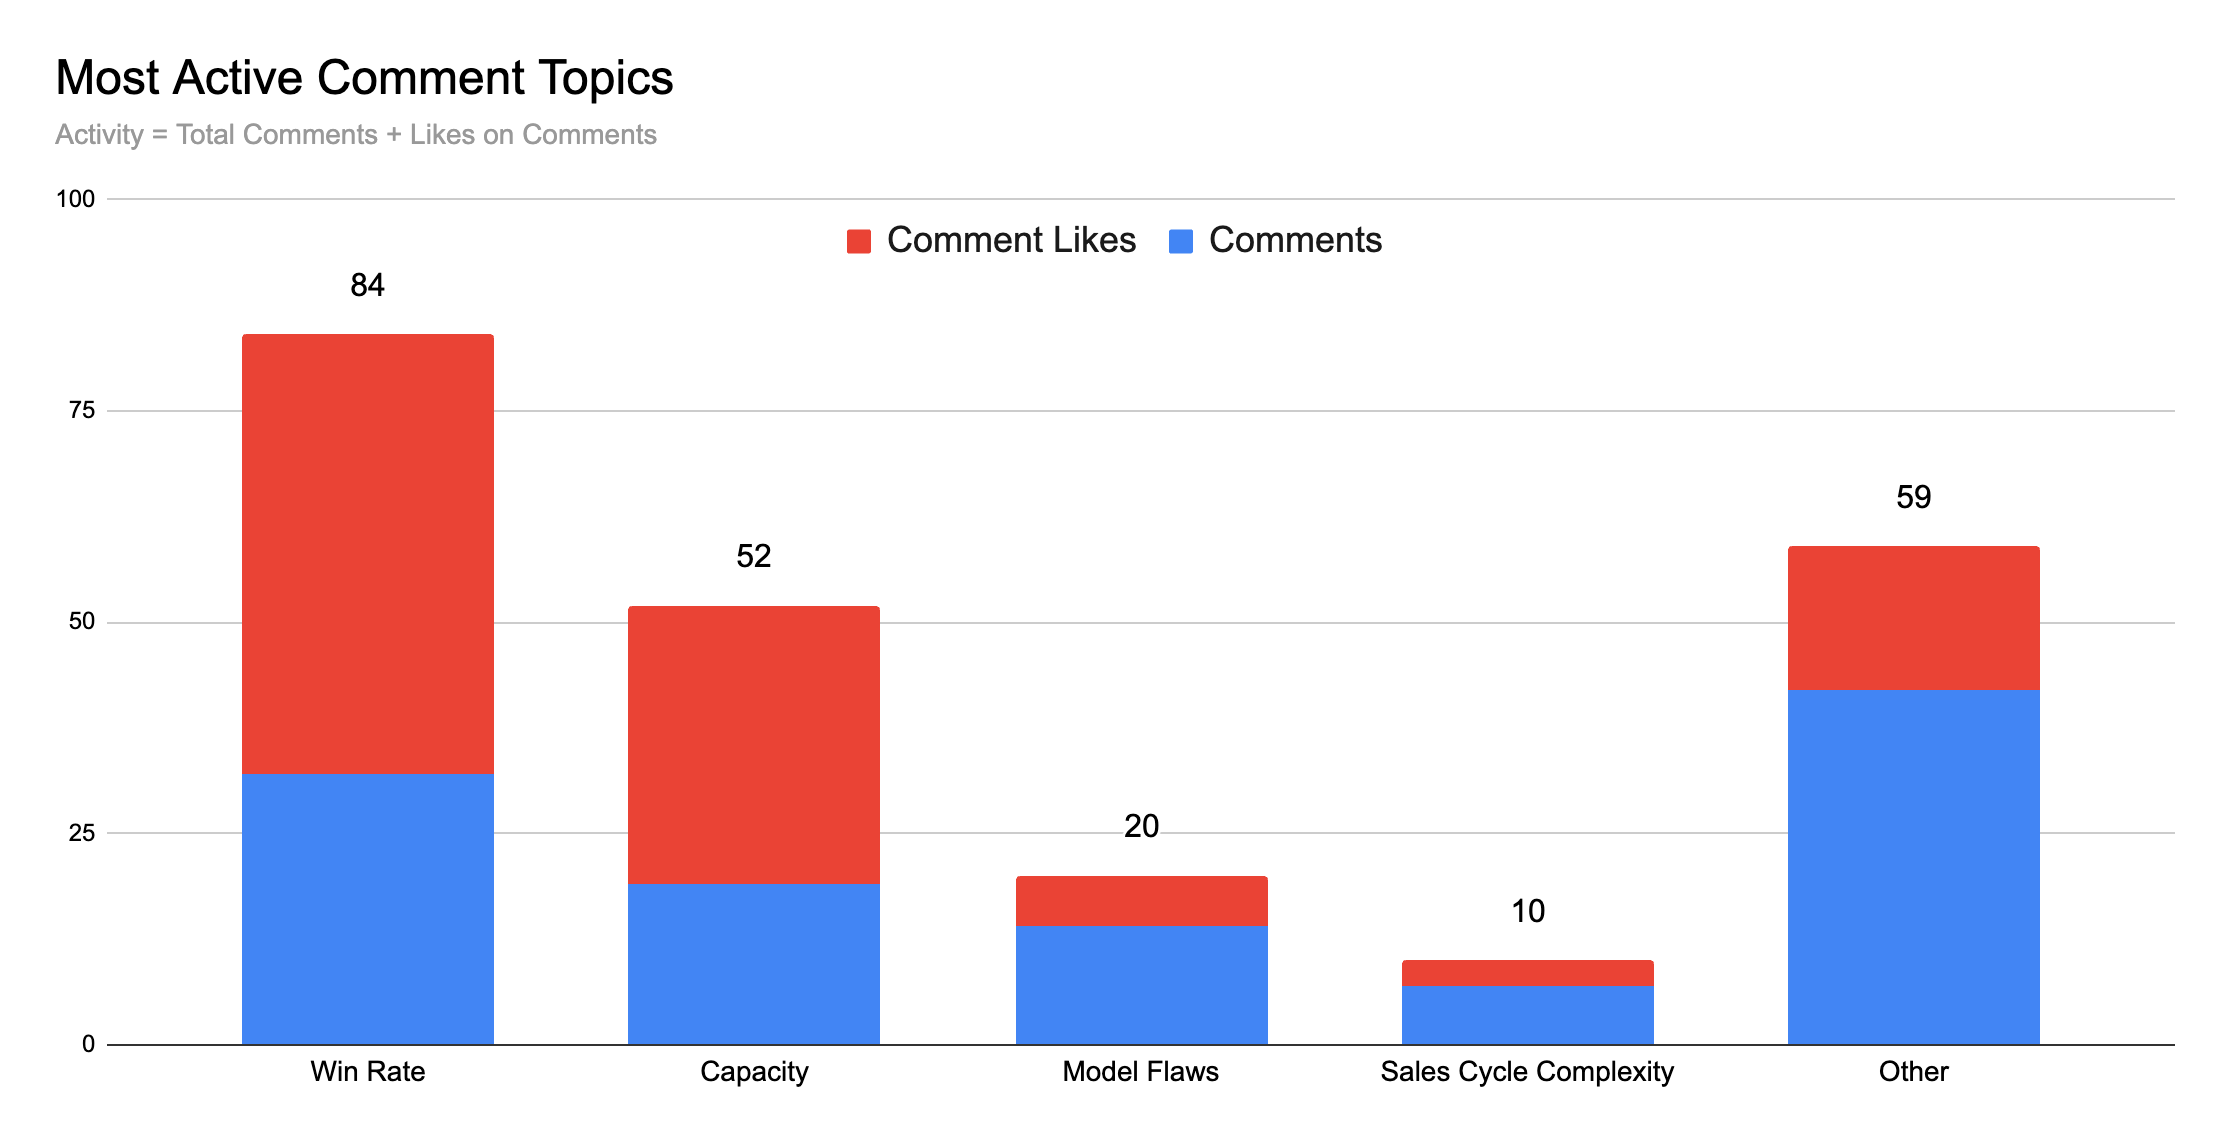
Here’s quick guide to how ChatGPT and I defined the topics:
Win Rate - relates to win rate, close rate or similar
Capacity - relates to excessive meetings, activity levels, sales capacity/time, overwork, burnout, or similar
Model Flaws - describes the assumptions or math in the model as unrealistic or otherwise flawed
Sales Cycle Complexity - relates to sales cycle length, buyer behavior or legal/finance/stakeholder performance
Other - anything that doesn't fit into the above categories
Let’s dig into each one to look at some of the substantive critiques. (Except Other. That’s a potpourri we don’t need to deal with here.)
Win Rates (aka nobody bats .500)
The most controversial part of the efficiency model is the very high win rate. To wit:

Pete’s incredulous question is by far the most reacted-to comment. His company, Atrium, likely has a lot of this data so he knows what he’s talking about.
The Bridge Group largely corroborates Pete. Their 2024 SaaS AE Report pegs the $50-$100k ACV win rate at 16% in 2024, down from 20% in 2022.
So yes, a 50% win rate is very high—maybe unbelievably so. I suggested it might be possible because better prospect targeting with AI would lead to higher quality pipeline at every stage and a truly good AI co-pilot could give reps a kind of “omniscience” for deal context that would help them improve.
This is probably a good place for the LinkedIn hive mind to push back. It really does strain credulity that you could get a 50% win rate. That would require basically tripling the win rate reported by The Bridge Group.
We can, however, assume win rates are going to follow a bell curve (aka a normal distribution). We can guess the average (~16%) but I don’t have data that helps me understand the standard deviation. My guess is that it’s pretty large—clearly some teams perform way better than the average. Some commenters mentioned personally experiencing win rates in the mid 30% range.
Without a better understanding of the underlying data, we can’t really say how crazy it is to get to a 50% win rate. If anyone has good data on this, let me know.
What I can say is that many, many sales teams operate with bad territories and chase signals on poor ICP fit accounts. Targeting is often the bottleneck preventing teams from doing less to win more.
The potential win rate lift from AI-assisted account selection is barely understood yet and I daresay it will be larger than the impact from running better AI-assisted sales cycles. Maybe it’s not batting .500 but maybe .400’s in sight?
Capacity (aka everyone’s gonna burn out)
10x reps would have to work very, very hard. I’ll separate this into two categories: the merely incredibly hard and the impossible.
The meeting count is merely incredibly hard, as Danie Ives points out:

If we assume these meetings are an average of 30 minutes, this is 3-4 hours of meetings per day. Is it hard? Yes. Impossible? No (in isolation).
I think the burnout part is less of an issue. People will work incredibly hard for the promise of making a lot of money. Finance bros do it all the time. This type of output would lead to a 7-figure W2. Some people will try it. I’m not saying they should or that it’s healthy—just that some folks will.
Now to where I did get it wrong. The meetings combined with the manual outreach touches is pretty much impossible, as Cameron Harvey points out.

You just can’t do that many touches plus meetings. Reconsidering this increases my skepticism of the efficiency model slightly.
My hypothesis is that the right kind of “human-in-the-loop” AI prospecting system could make relevant, manual outreach less time consuming for reps. I still think that’s true, but 50 touches is still stretching it. This implies we need a smaller number of higher-impact human touches. I’m all for that. This could work but it threatens the opportunity conversion rate.
Overall this puts us a little closer to having to deal with larger legal and cultural changes—like people being willing to talk to AI avatars or accept AI phone calls—than we did before in the efficiency scenario.
Model Flaws (aka spreadsheets aren’t reality)
It turns out a spreadsheet does not capture the fullness of our lived reality.

I’m not picking on Clark. He’s right! And many others had the same perspective. That said:
“All models are wrong, but some are useful”
— George Box
You may believe this is a model that’s both wrong and useless. Which, fair.
But overall I find this the least substantive critique. Without trying to model out the what’s required for a 10x rep and trying to work backwards, we’re guaranteeing that we approach the whole thing from the realm of pure opinion or “AI is magic” cheerleading. And that’s also horribly wrong 100% of the time, if you ask me.
Sales Cycle Complexity (aka nobody sells alone)
This feedback was great because I hadn’t considered it all in the model. The gist here is that this hypothetical 10x rep is operating within a system of dependencies—legal, finance, procurement, etc—any of which could hold the rep back.

Honestly, I think this isn’t a big deal. I’ve seen very good commercial legal teams work through hundreds of contracts in a quarter supporting hundreds of sellers. Accounting as well.
So yes, legal reviews are slow and redlines are annoying but this is mostly solved. Supporting 10 of these 10x reps would be no worse than supporting 100 1x reps. There are plenty of orgs that do that today.
The one thing to watch out for would be dragging the rep into lots of procedural meetings (e.g. redlines, infosec). There’s no way a 10x rep can sit on a call twiddling their thumbs while two lawyers talk about indemnification. This means having a team (or AI, if you want that legal risk) that can handle those conversations without the rep.
Wrapping Up
I really did appreciate all this substantive feedback. Without more data on win rates, it’s not clear how unobtainable a 50% win rate is. It’s also clear that we can’t ask reps to do quite as many meetings combined with manual tasks as my original model called for. Even an AI-equipped rep isn’t a machine.
I’m slightly more skeptical than I was thanks to this input. Overall, though, I still think the 10x rep is possible and I still think the efficiency play is the way to get there.
Coda: How I did the AI analysis
Step1: I used PhantomBuster to scrape the comments on my post2 and put them into a spreadsheet. It did a very nice job of this even though I had to pay to export more than 10 comments.
Step 2: I uploaded the CSV from PhantomBuster and asked ChatGPT’s o3 model (4o didn’t give me good results) to analyze the comments. I started with this prompt:
Fully review the text of ALL the comments in the provided file. Use the MECE (mutually exclusive and collectively exhaustive) framework to identify no more than 10 category labels that could be used to classify the comments. Your labels should be 1-3 words long. Output the labels, describe each one and give examples excerpts from comments for each.
This gave me a nice table of output. I negotiated a bit with o3 to trim the list down to roughly the ones you see in the post.
Step 3: I went through several iterations with o3 asking it to apply the labels from the previous step to each comment. My first attempt looked like this:
Give me a new CSV with a column called "label" appended. Read the comment on each row and label that row using one of the labels from the provided taxonomy.
This gave me the CSV I wanted but I didn’t like the results. Watching o3 work, it seemed set on trying to do keyword matching in python to select labels, so I phrased the prompt differently:
I'd like you try classifying the comments without writing code. I'd like you to match to the best label by reading the comments like a human would. Use your own internal knowledge to do so. This probably means looping over each comment and thinking about it before applying a label.
This, along with a few more tweaks to the labels got me solid results. I still spot-checked and changed a few by hand.
Step 4: Once the labeled data was all in a spreadsheet, I just pivoted on the label column and made a chart. Not bad.
In honor of Paul Graham’s famous essay about the “10x developer”.
LinkedIn data scraping exists in a legal and technical gray area so I try to keep it to a minimum as I’d rather not get banned. This use case felt very reasonable. They’re comments on my post—I deserve to be able to put them in a spreadsheet!
First time I’ve seen linkedin trolling visualized as stacked bar charts. 10/10 no notes.