


I’ve been more than a little busy lately. Like all of you, I’ve got a number to hit and Q4 is crunch time. That has, sadly, slowed down my writing. My sincerest apologies to those of you who have been eagerly awaiting my next 2,500-word think-piece about RevOps, agents, or agents doing RevOps.1
Well, you’ll have to wait a little longer because today I’m aiming for something a little less think-piece and a little more practical toolkit.
I’ve recently spent some time with a RevOps team at a mature SaaS company. They’re at 9 figures in revenue, PE-backed, the whole deal. These are smart folks, working with other smart folks, yet they found themselves in an altogether too-common situation: leadership had put together a very aggressive plan for 2027 and was asking them to—in the immortal words of Captain Picard2—make it so.
Like most such plans, it was built very much from the top down. They started with a revenue number they needed3 to hit, set a per-rep quota, chose an “industry standard” attainment number, and backed themselves right into a hiring plan. This plan, naturally, involved hiring a lot of people. People who are going to generate pipeline by doing a bunch of outbound even though the current reps aren’t exactly knocking it out of the outbound park today.
Now, you might instinctively be a bit skeptical. But why? When you hire a lot of people and tell them to outbound real hard, you get a lot of sales. It’s right there in the spreadsheet. All the numbers tie out neatly, so it must be true…
Ok, enough sarcasm. Most of us have found ourselves in some version of this situation. You’re given a similar kind of plan and told to “go figure it out”. Your first response might be to throw up your hands and say “this is BS!” and start cleaning up your resume. That won’t get you anywhere. A healthier response is to meet their spreadsheet with one of your own.
Your spreadsheet, however, should aim to tie the top-down plan to the actual on-the-ground work that needs to happen to make the top-down plan happen—in particular the hiring, ramping, pipeline creation, and outbound effort necessary to produce the top-line numbers. Armed with the right bottom-up view, you can spot the risks. And you can communicate those risks clearly to people who live in financial models without sounding like Chicken Little.4
In my case, I was asked to help the aforementioned RevOps team with their territory and account allocation design for next year. To do that, I needed a good bottom-up model to really understand the drivers of their aggressive plan. It had been a few years since I’d built one from scratch, so I decided to build one with a particular focus on hiring/ramping and outbound coverage.
That model led to a productive data-driven conversation with their leadership about the plan’s risks and ways to mitigate them, so I figured I’d share a version of it here with plenty of customizable inputs that you can use for your own teams. All numbers have been changed to protect the innocent.
You can access the Google Sheets version here. It’s readonly, so just make a copy for yourself.
So, open it up on a big monitor and let’s walk through some of the key pieces.
How it works
The model has two tabs that drive everything:
Full Model - this takes all your inputs and models month-by-month bookings, pipeline generation requirements, and outbound coverage levels.
Hiring - this models out the details of the hiring plan by applying cohort-based attrition and ramping to your top-line new hires. That then feeds back into the quota capacity parts of the Full Model.
There are two other tabs that provide outputs:
Full Model (Quarterly) - this rolls up the monthly data from the Full Model into quarters. Boards often want quarterly data as a summary and this provides that.
Charts - provides a set of charts to help you visualize the inflection points and risks in the plan.
You’ll notice that some of the cells have different colors. For those of you used to reading FP&A models, the color coding should be fairly standard:
Blue background - inputs you can adjust for your team
Green text - values derived from other sheets
Small light gray italicized text - supporting data or checks that aren’t part of the primary calculations
Yellow background - values that include specific assumptions (see cell notes for explanation)
To make the template reflect your own situation, make a copy and then adjust the blue inputs to fit your situation. Here are a few of the most important ones:
Full Model tab inputs
Use the Bookings Plan and Hiring Plan rows in the Full Model tab to input the current top-down plan on a monthly basis.
There are quite a few inputs along the left side. The most important ones are your starting team size, quota, attainment, and pipeline metrics.
Hiring tab inputs
The planned new hires come from the Full Model tab.
The attrition values on the left side control what percentage of your ramped or ramping reps you expect to lose in a given year. Those annual values are converted to monthly attrition rates.5
The “ramp curve” lets you control the ramp period (more on that below).
As you make your tweaks, pay attention to rows 51-53 on the Full Model. Those show you your estimated bookings (based on the hiring plan and attainment) and the variance relative to the top-down plan.
Breaking down the hiring plan
Any plan that involves aggressive top-line growth through hiring needs careful inspection. Missing on your hiring targets and/or your ramping assumptions will cause a significant problem, especially if the plan assumes that you’ll hire a lot of people early in the year who will then create a lot of top-line growth later in the year.
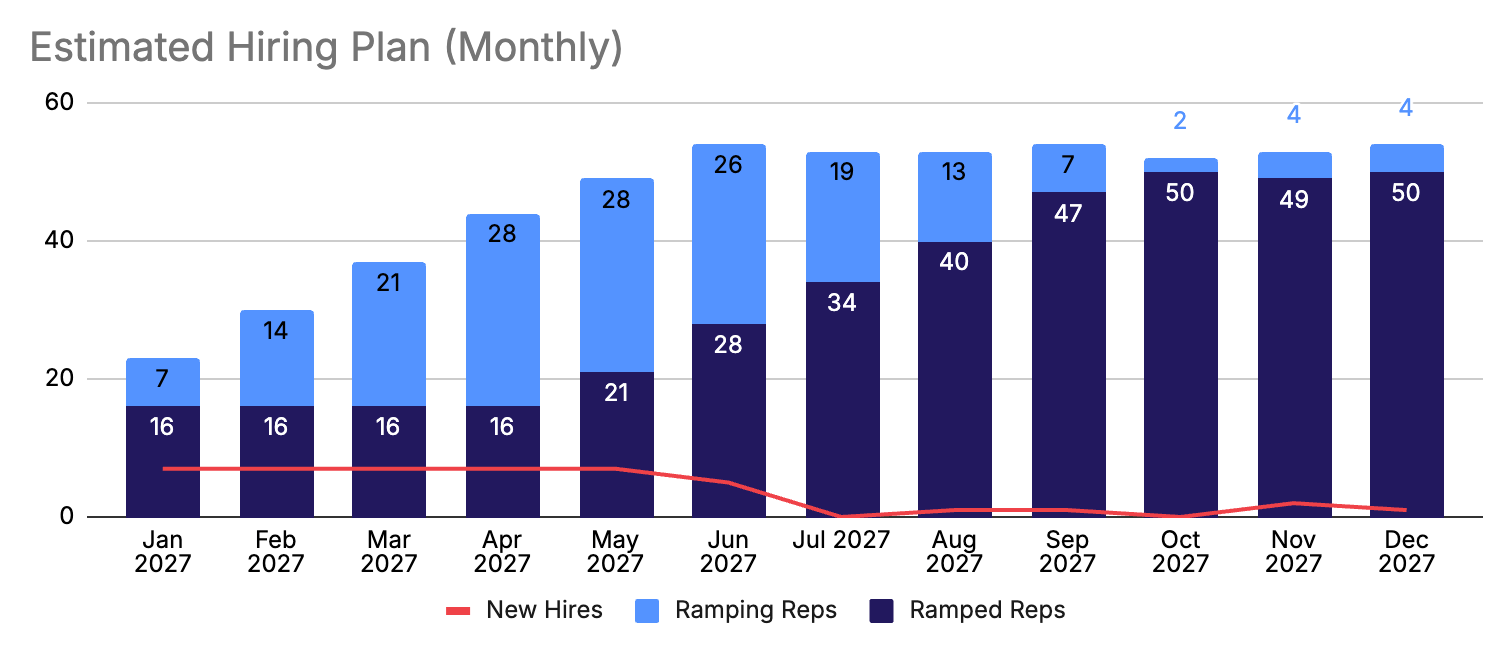
In the hiring plan in the chart above, you can see that all the planned hiring is front-loaded. That leads to estimated bookings being extremely dependent in the middle of the year on the performance of ramping reps, as you can see below.
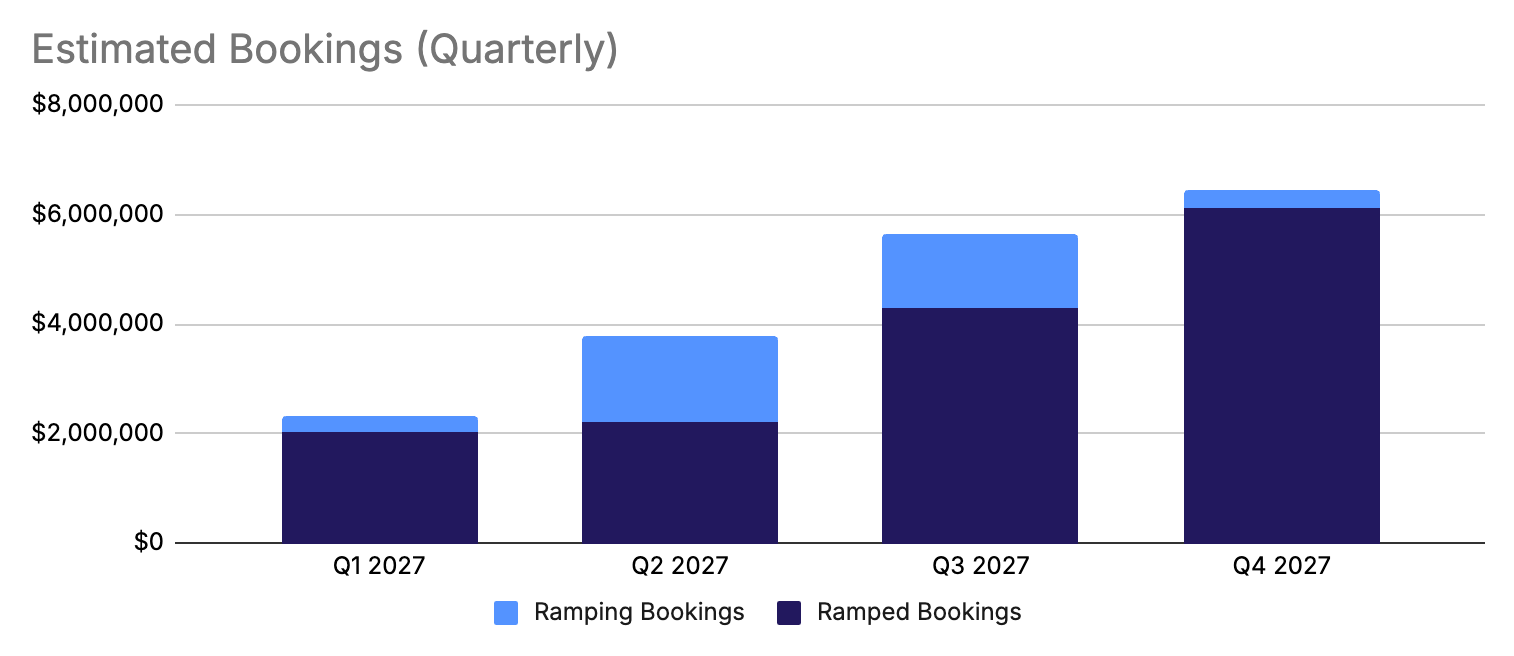
In addition to the timing of the hires themselves, you’ll also need to model two things carefully: rep attrition and ramp performance.
The model lets you tweak ramped rep attrition and ramping rep attrition separately in the Hiring tab. It’s generally a good idea to set ramping rep attrition a bit higher than ramped rep attrition to account for some mis-hires and failures-to-ramp.
(One side note on attrition: the model assumes that if you lose a rep, you can find a backfill the next month. I ran out of time to remove that bit of hard-coding and it’s one rare area where the model is probably overly optimistic.)
Separately, you can control the ramping reps’ contribution to quota capacity with the ramp curve. This lets you control ramping quota as a percentage of the fully ramped quota, by month of tenure. As an example, you could have your reps on a 3-month ramp, at 0%, 33%, and 67% quota before graduating to full quota in month 4. Most comp plans have a defined ramp quota, so you can plug those in as a starting point.
The model handles the ramp curve by taking each ramping cohort and applying a quota to it based on the tenure month for each cohort. That means the ramping quota for the whole team in any given month will be the blended value of all the ramping reps from different cohorts active in that month.6
You should test out different ramp curve scenarios even if your comp plan “expects” reps to ramp to 100% quota within a certain period of time. If reps actually end up taking longer to be fully productive, you can use a longer ramp curve to simulate that.
Finally, you can adjust attainment on the Full Model tab. There’s only a single percentage number for attainment. For ramped reps, this applies to their standard quota. For ramping reps, it applies to their ramp quota. So if the ramp quota is 50% of the fully ramped quota for a given cohort in a given month and attainment is set to 65%, the actual bookings from that ramping cohort will be 32.5% (50% × 65%) of the ramped quota. I’ve written about the perpetual decline in attainment before—the Bridge Group pegged median attainment at 51% in 2024—so it’s a good idea to assume the worst here.
Now, let’s move on to how all those reps generate pipeline.
Understanding outbound capacity
I’ve written a great deal about outbound capacity in the past, including about one of my favorite metrics: opportunity creation rate (OCR). OCR is the percentage of accounts your reps engage with that turn into an opportunity. It’s a high-level measure of efficiency. This model doesn’t use it as an output driver; instead it uses it as a check to evaluate risk. Let’s look at how that works.
OCR is just a percentage:
To use it OCR as a check, we need to compute the numerator and the denominator.
The model allows you to input your coverage metrics and activity levels to determine how many accounts your team can fully engage over any given month. That becomes the denominator for your OCR metric. I encourage you to be cautious here. Even with AI-assisted outbound, there’s still a limit to how many quality activities you can do in a given month.
The numerator comes from doing reverse pipeline math, taking the top-level target into account and using the average deal size to calculate how many deals are required to get there. From there you can use the win rate to determine how many opportunities the target requires and then the sales cycle length determines when you need to produce the opportunities. That gives you the numerator for OCR.7
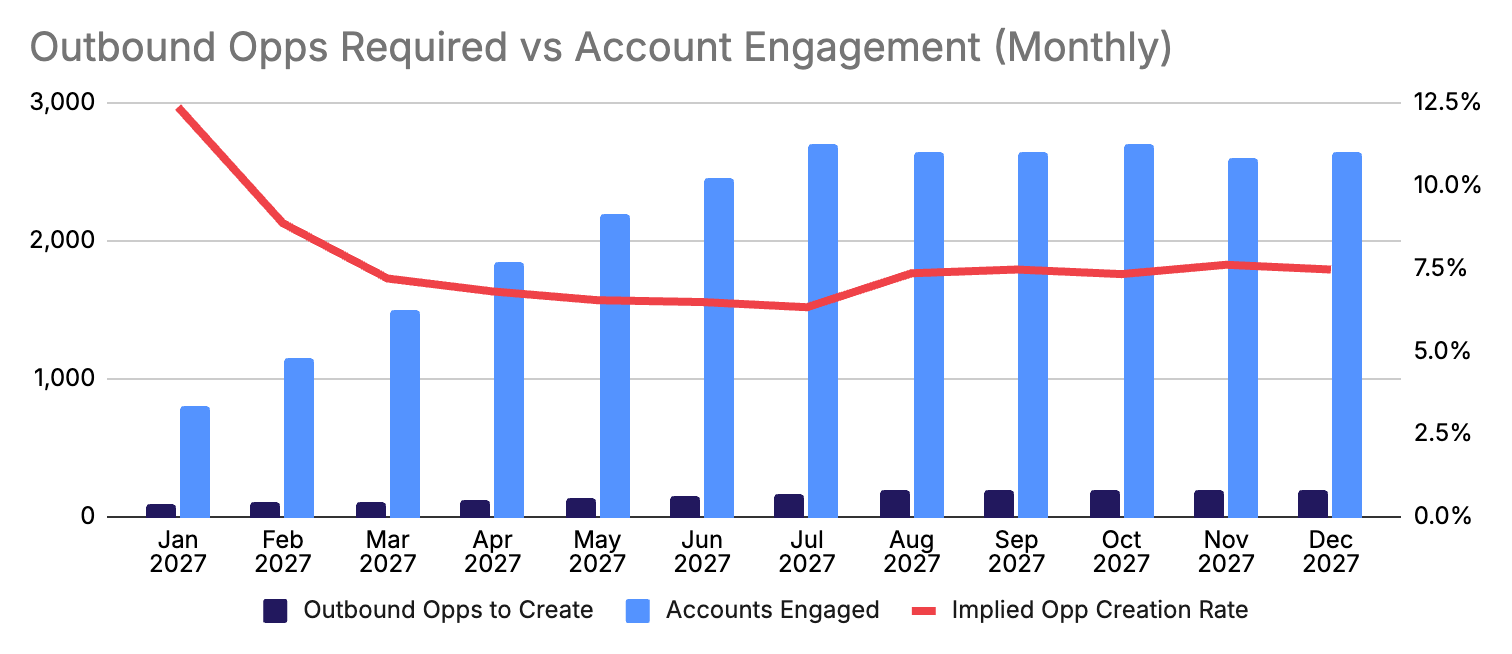
Put all that together—bottom-up coverage capacity combined with the number of opportunities required to hit the top-down number—and you get an implied OCR as in the chart above. We typically see OCRs range from 6% to 12% for outbound teams. If your OCR is at the high end of that range at any point in the plan, there’s a significant risk that you won’t build the pipeline coverage necessary to hit the plan.
Consider the percentage of opportunities that will come from outbound as well. This model is built for sales teams, so it doesn’t try to model the detail of the other sources of pipeline (marketing, partners, etc.). If those don’t materialize, that increases the amount of pipeline required to be produced by outbound, which puts even more stress on your outbound efficiency.
Wrapping up
The best way to use this model is to model different assumptions to show what-if scenarios. For example:
What if we aren’t able to hire as quickly as we hope?
What if ramping reps leave at a high rate and take longer to get productive?
What if we have to produce more outbound pipeline because other sources don’t produce as much?
What if our pipeline metrics are off and average deal size, win rate, and sales cycle don’t look like we expect?
Each one of these will produce a different top-line bookings output with a variance against the plan as well as the required outbound efficiency your team needs to hit in the form of OCR. This implied OCR acts as a check to help you understand whether it’s realistic for your team to produce outbound pipeline at the required rate.
Collect these what-if scenarios and walk through them with leadership. Worst case, the plan stays and you’ll all have a sense of where you need to be very careful. Best case, you adjust the top-line in a way that reduces some of the execution risk.
Either way, you’re demonstrating a well-thought-out response—one spreadsheet to another. And that’s the best way to call BS.
Or perhaps you just miss the occasional pixelated cowboy image.
Needs, wants, hopes, and dreams sometimes get conflated when you have a value creation plan that you used to justify a deal.
TIL that this story is called Henny Penny outside the US and that in many versions a fox eats Chicken Little eventually. All these old folk tales are pretty dark.
I treat this like a churn rate so the formula is a little more complex than just the annual rate divided by 12.
Getting to this level of nuance is the reason for most of the cohort-based complexity on the Hiring tab. It’s a lot of machinery, but it helps you model the real world much more accurately.
This makes the simplifying assumption that we don’t create more than one opportunity per account which, for outbound, is usually fair.